
Profiler for C++, C#, .NET and Delphi
Full integration with Visual Studio • Finds any leaks: memory, GDI, handles and others • Profiles unmanaged and .NET code • Supports both 32-bit and 64-bit applications • Rich reports • Export results to XML
Why Deleaker?
C++ memory leak detection
Deleaker is an extension for all major IDEs and a standalone application for memory leak detection - memory, GDI, and handles so far.
Even the most stable of Windows applications are not immune to resource leaks. And of all the bugs and issues, memory leak detection tends to be the most difficult, especially when found in GDI objects and menus. And the golden rule of thumb is that the sooner bugs are found and dealt with, the less expensive they prove to be.
While there's no shortage of tools and add-ons to help track down memory leaks, few are capable of tracking GDI resource leaks that can devastate Windows performance. Deleaker is one of the few tools capable of this, and will have a minimal impact on your application's performance.
Deleaker is a memory leak detector that integrates with all major IDEs: Visual Studio, Delphi, C++ Builder, and Qt Creator.
Get 14 Days Free Trial
Please enter a correct e-mail to get a demo version.
If you don't receive a letter please write us.
Main Window

Visual Studio Integration

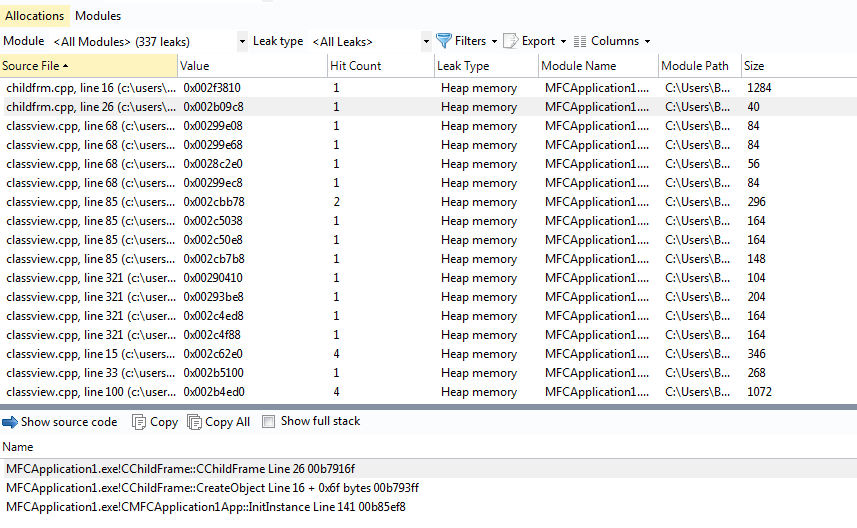
Allocations
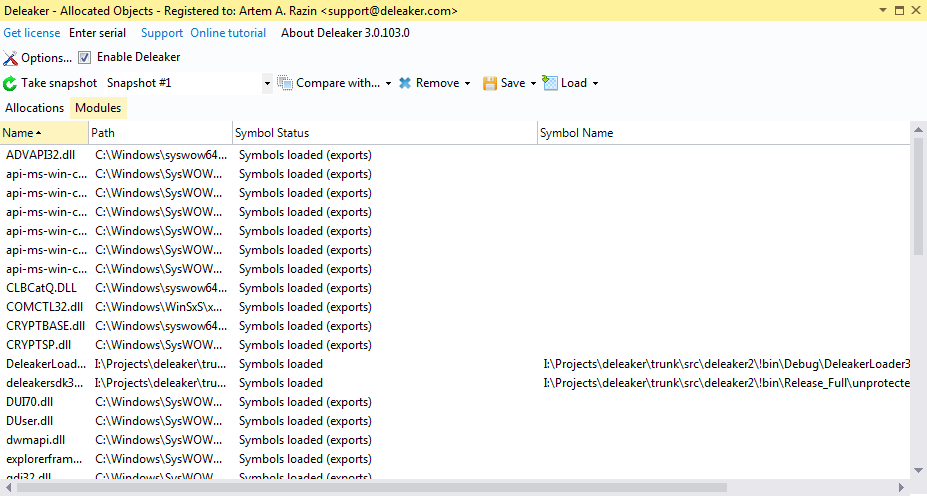
Modules
What Does Deleaker Offer?
Find all the memory leaks
It doesn't matter what type of leaks are occurring, Deleaker will find them all: memory leaks (produced by heap, virtual memory, or OLE allocators etc.), GDI leaks, leaks of Windows USER objects and handles.
Visual Studio integration
Being a Visual Studio extension, Deleaker tightly integrates with your favourite IDE. At any time you can see list of all allocated objects. Visual C++ 6.0, Visual Studio 2005, 2008, 2010, 2012, 2013, 2015, 2017, 2019, and new 2022 are supported.
Standalone version
Visual Studio isn't required for Deleaker Standalone. The standalone version debugs any application and shows all current allocations. You can run it on a client machine that doesn't have Visual Studio.
Integration with Qt Creator
Deleaker provides a plugin for Qt Creator to check memory leaks in C++ and Qt. Whenever it's necessary, you can explore allocated memory, GDI objects and handles. Navigate to the source code of a leak to fix it without leaving Qt Creator.
Watch video Tutorial
RAD Studio integration
Deleaker detects leaks in Delphi and C++ Builder. As an extension for RAD Studio, Deleaker shows allocated memory, objects, handles and GDI resources. Fix all the leaks without leaving RAD Studio.
Watch video Delphi tutorial C++ Builder tutorial
Use in continuous integration
Deleaker has a command line tool that can be executed in the CI process to automate taking and exporting snapshots and to prepare leak reports.
Copyright © Softanics. All rights reserved.