Developers often ask how to detect memory leaks in Visual Studio. The newest versions of Visual Studio include some tool to monitor heap allocations. It’s a quite limited one for C++ developers that gives basic information about allocations only.
Fortunately, there is an extension to find leaks that integrates with Visual Studio, Deleaker. Deleaker supports all Visual Studio versions, including old 2005, 2008, 2010, and the newer 2013, 2015, 2017 and 2019. Once any new Visual Studio version is released, Deleaker is ready to work with it immediately.
First of all, run the Deleaker installer and choose any Visual Studio versions you want Deleaker to be integrated with.
Then launch Visual Studio, now Deleaker is available via Deleaker menu. To open Deleaker Window click to Deleaker – Deleaker Window. At any moment you can take a snapshot to review allocated resources, export and import snapshots, compare them and prepare reports.
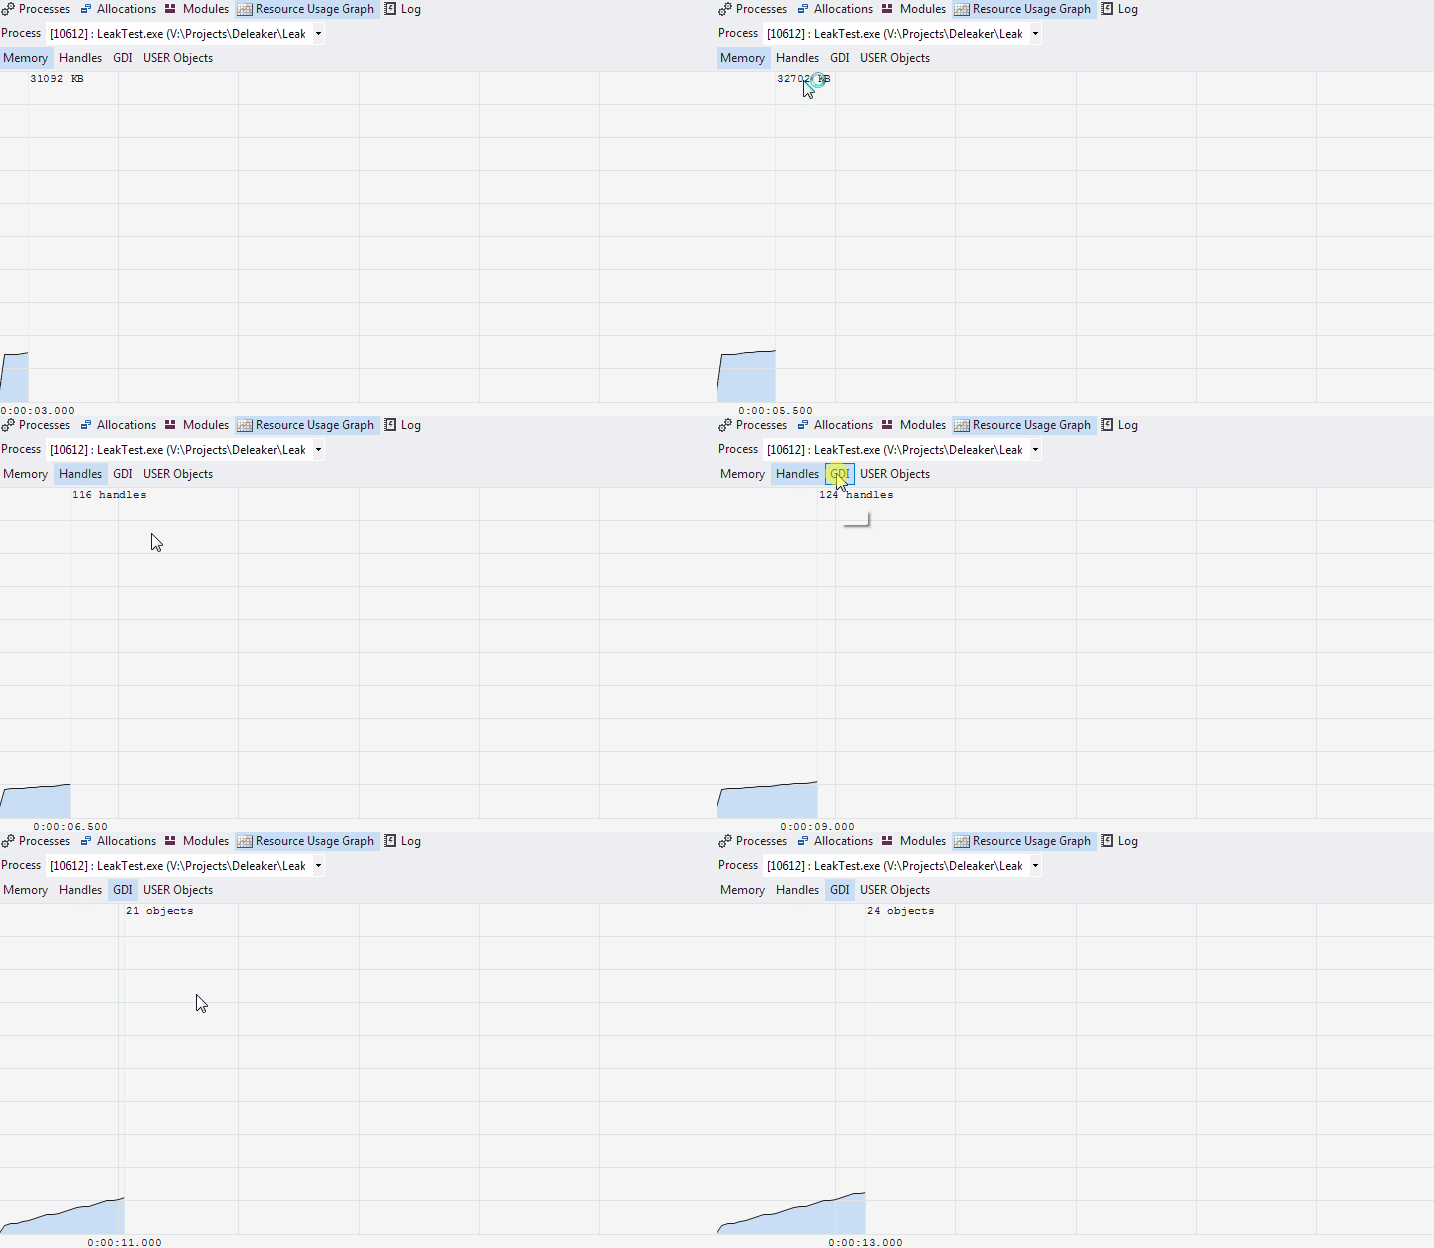
To monitor memory usage and to check how much resources (memory, GDI objects, handles) a process consumes, switch to Resource Usage:

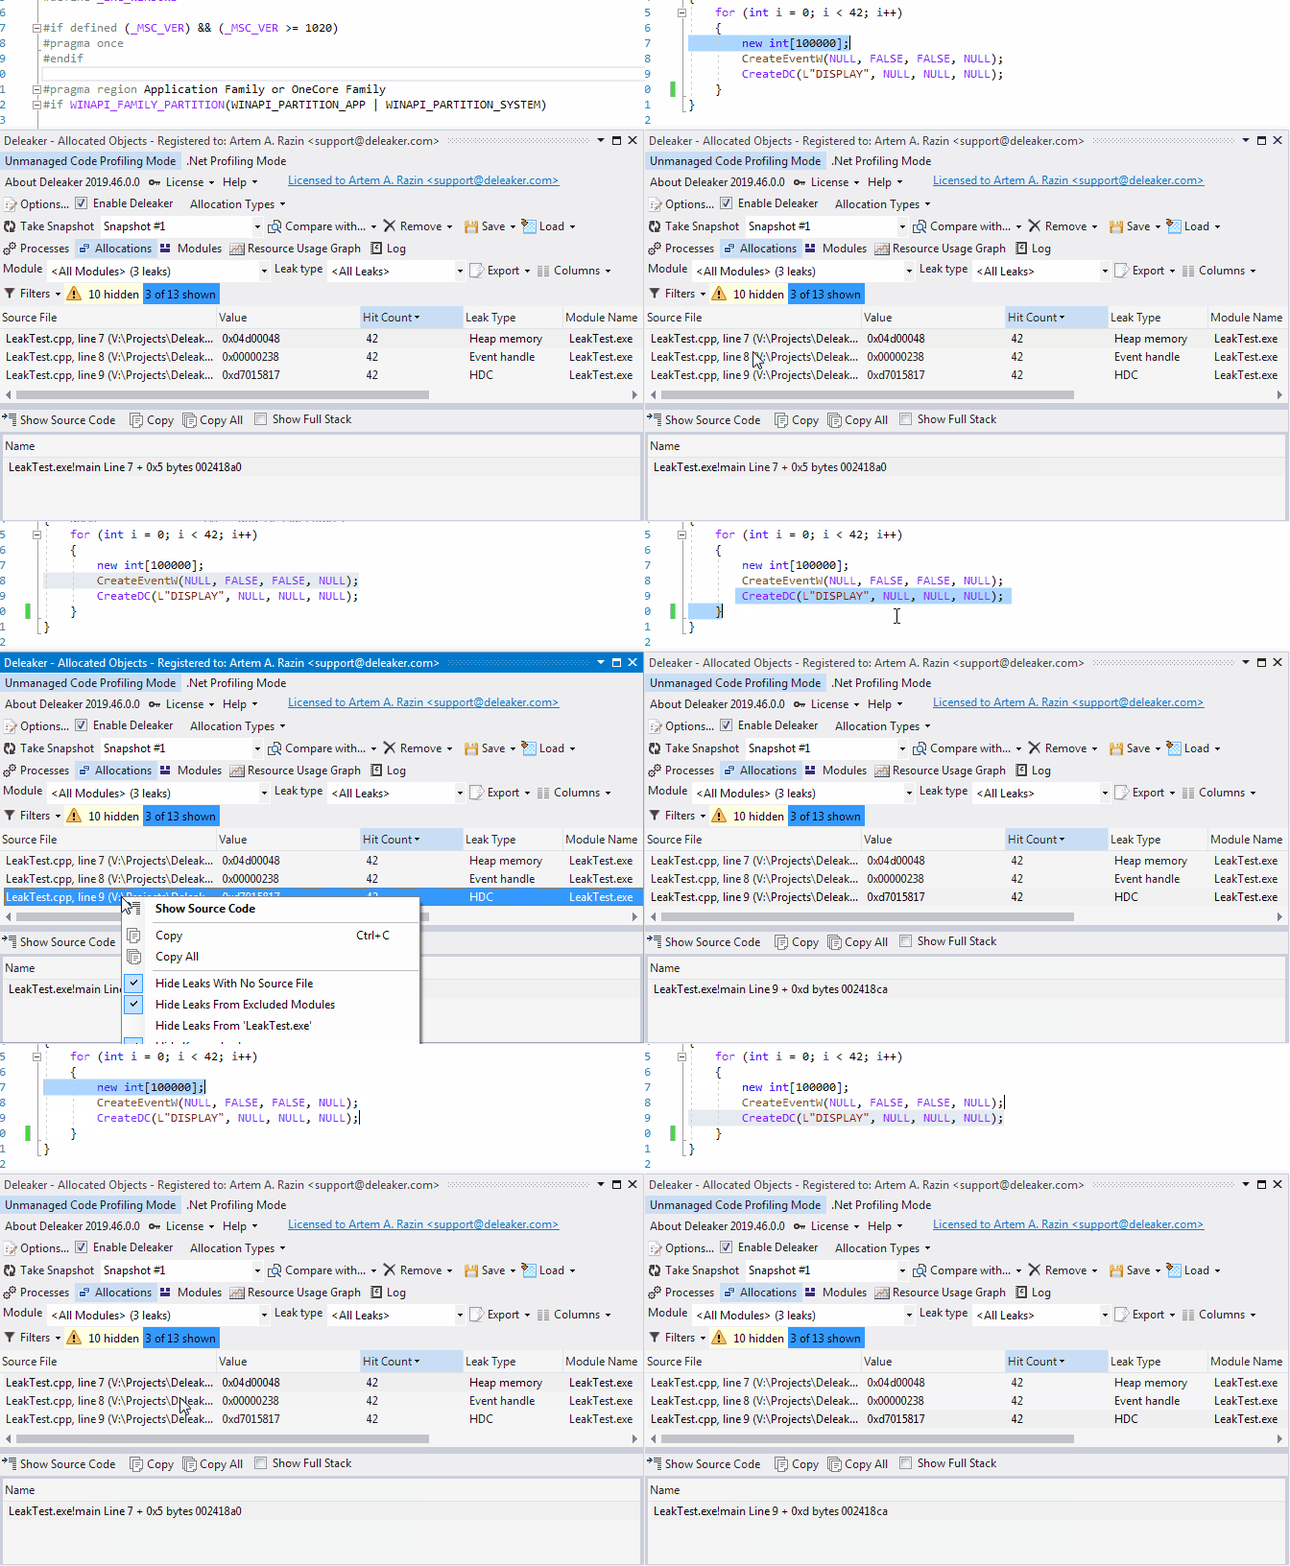
When a process exits, Deleaker shows detected memory leaks in details. For each leaked pointer Deleaker displays its value, size, hit count (count of allocations made at the same place), module name and full path. A detailed call stack helps to identify where an allocation has been made. Debugging the memory usage is really simple with Deleaker: double-click at any pointer in the list to immediately follow to the source code to fix memory leak:

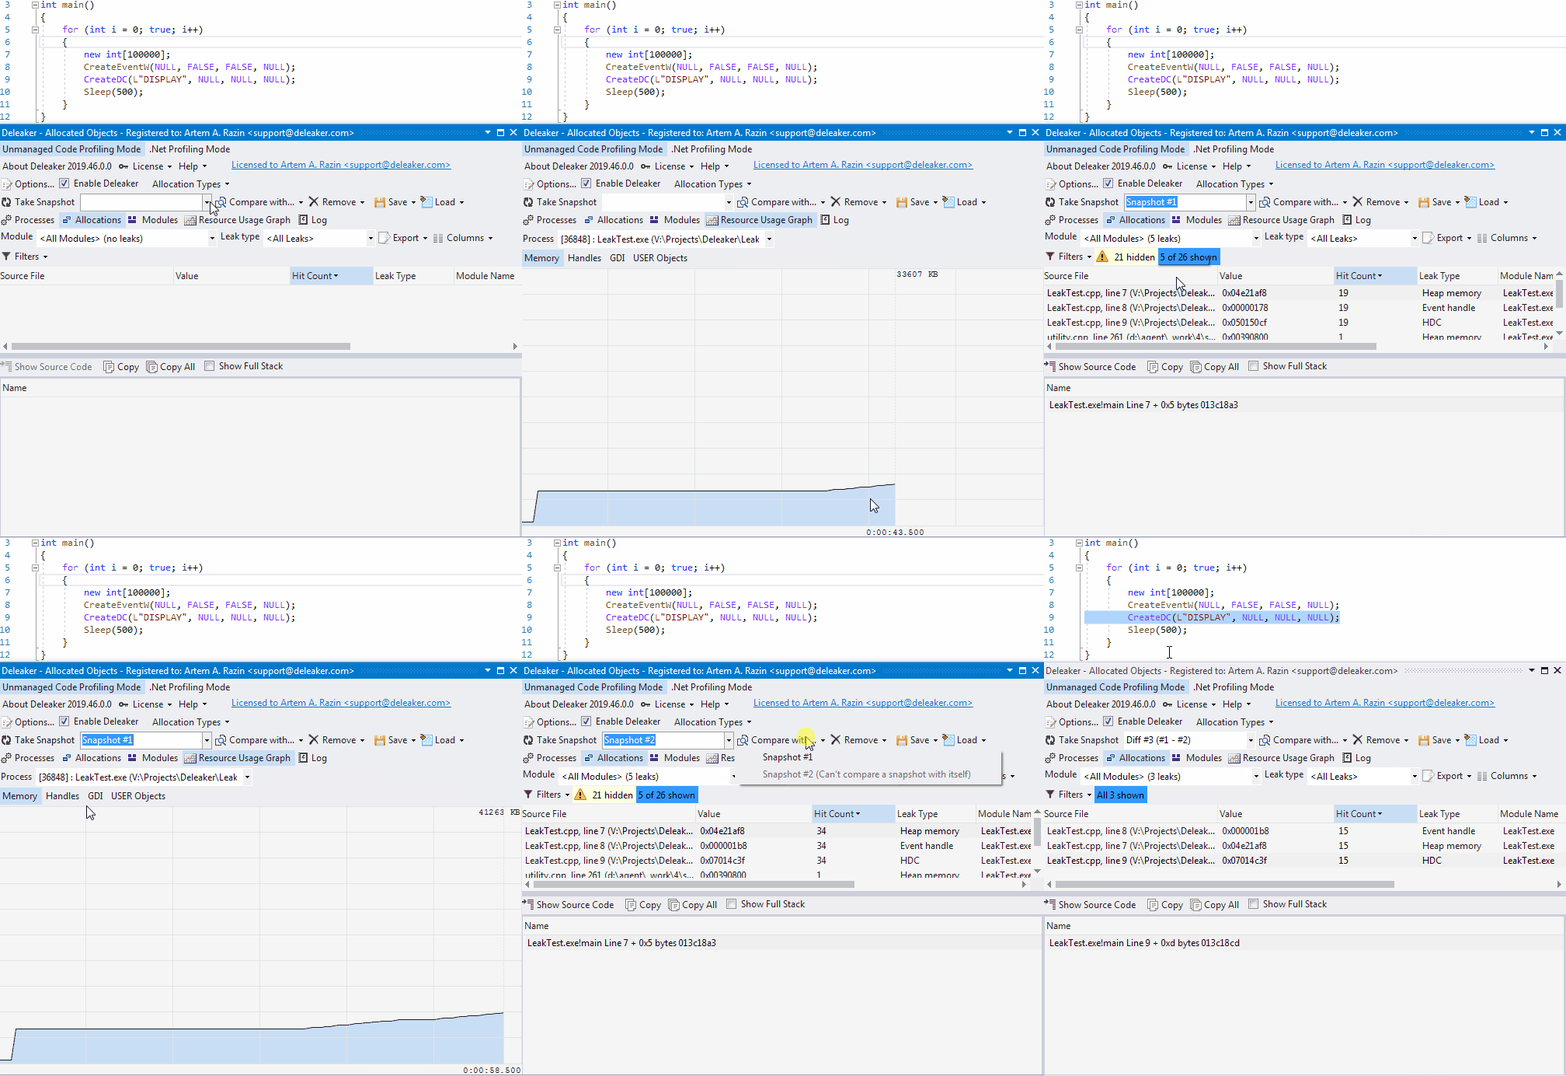
Another often used feature is comparing snapshots for memory leakage detection. Imagine that some code allocates memory permanently. To distinguish only those allocations that are accumulating, take two snapshots. Select the second snapshot, click to Compare With… and select the first snapshot:

Conclusion
Deleaker is a memory profiler that tightly integrates with Visual Studio to help developers to find leaks without leaving the IDE. Deleaker supports C++ and .Net; it is able to debug both 32-bit and 64-bit processes.