How to fix detected memory leaks?
It’s safe enough to say that every day hundreds of C++ developers get the message “detected memory leaks” in their Visual Studio. That is how you would view it:
Detected memory leaks!
Dumping objects ->
{219} normal block at 0x00639450, 1024 bytes long.
 Data: <                > CD CD CD CD CD CD CD CD CD CD CD CD CD CD CD CD
Object dump complete.
Of course, all developers want to fix such an error as soon as possible. In this article, we will show how to activate CRT leaks detection, how to utilize CRT to catch leaks, and tell you about the better and simpler way to catch leaks in C++ applications, no matter where they come from: CRT, MFC or usual heap allocation functions.
How to enable the CRT memory leak detection?
You never got the message above by default. To activate leak detection, you should add some headers and defines, and finally call _CrtDumpMemoryLeaks:
#ifdef _DEBUG
#define _CRTDBG_MAP_ALLOC
#define _CRTDBG_MAP_ALLOC_NEW
#include <crtdbg.h>
#include <assert.h>
#endif

int main()
{
    auto p = new int[0x100];

    std::cout << "Hello World!\n";

    _CrtDumpMemoryLeaks();
}
After that rebuild the project and run. You will see the famous “detected memory leaks” in the Output Windows.
How does the CRT leak detection work?
This message tells a developer that CRT (C Runtime Library) or MFC has found a memory leak. In other words, somewhere a memory block was allocated but the developer has forgotten to free it later.
Internally, CRT stores a list of allocated memory blocks. When a function _CrtDumpMemoryLeaks is called, it outputs information about live memory blocks in a human-readable format to the Output Window.
Tip
If you want to dump the information about memory leaks to a file, instruct CRT to use a file by calling _CrtSetReportMode with _CRTDBG_MODE_FILE, and then call _CrtSetReportFile.
Unfortunately, often CRT shows very little information about leaks: only size, content, and allocation number. As you see, it doesn’t include the most important information: a call stack. Moreover, you need to know where the memory was allocated to fix it.

When a CRT allocates a memory block, it increments a counter that saves it to the header of, that has just been allocated. If you are lucky, the allocation number can help you catch a leak. In the case of a simple program, if its flow is the same on each run, each allocation has the same number.
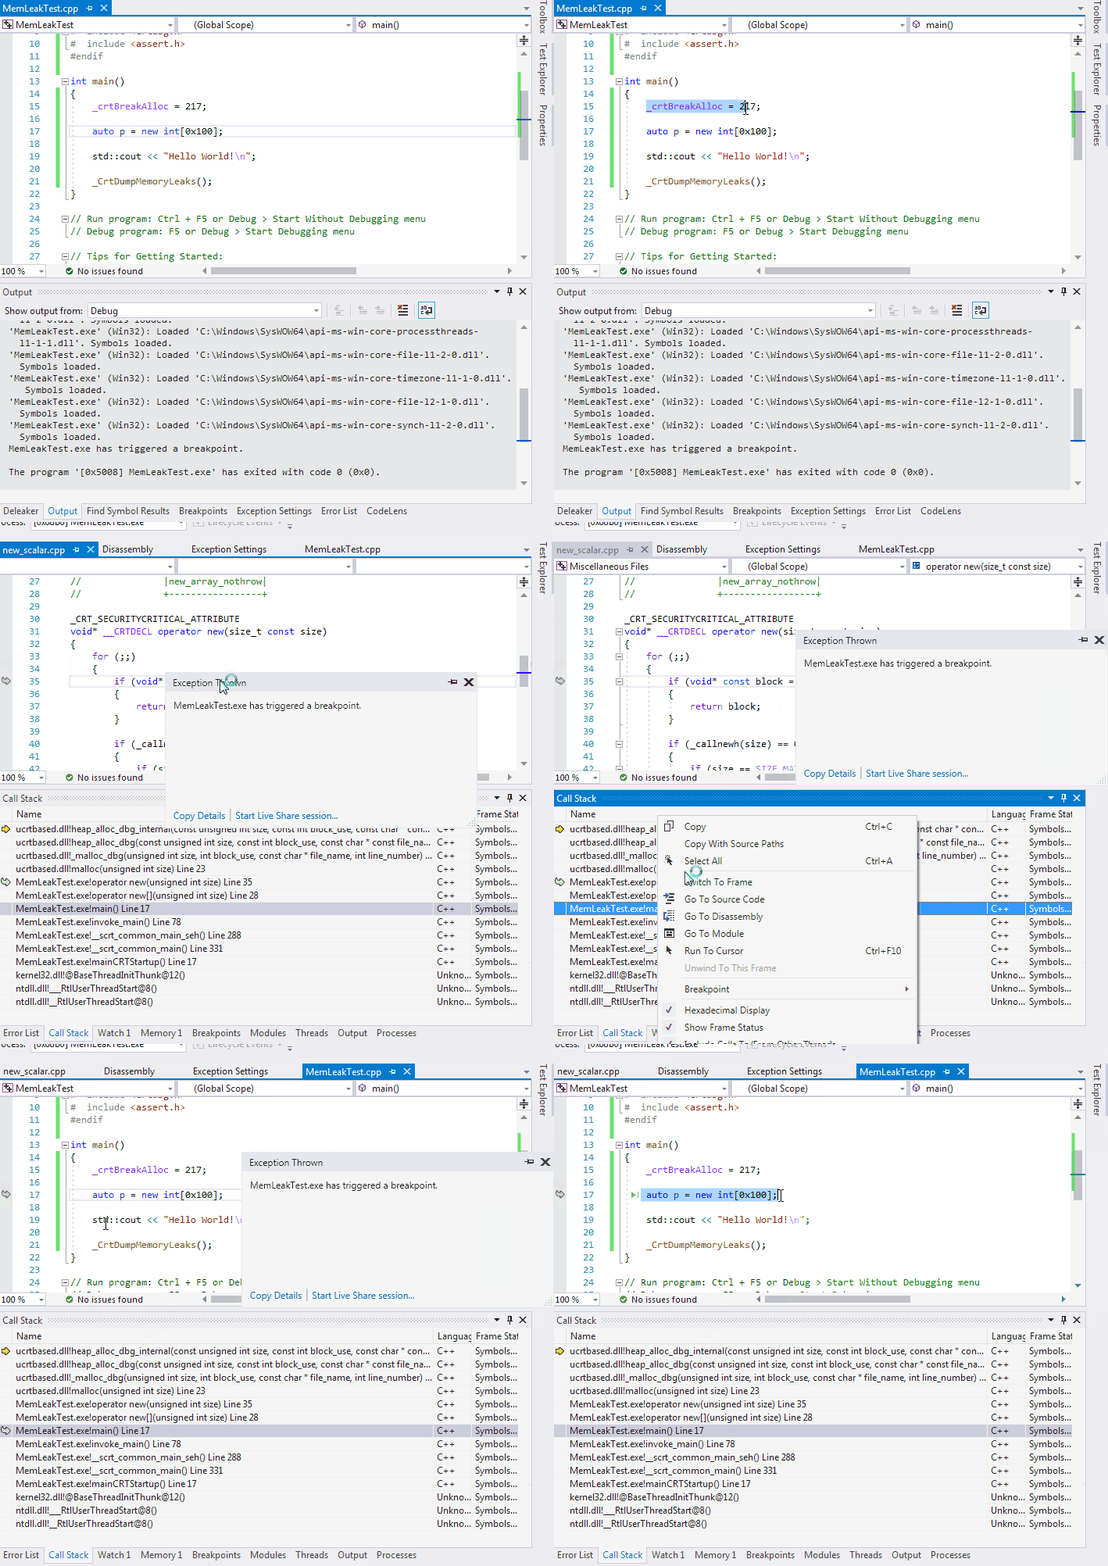
To try to catch the leak, set _crtBreakAlloc to allocation number of the leaks, and run the debugging once again. CRT breaks when an allocation number reaches the value:
int main()
{
    _crtBreakAlloc = 217;

    auto p = new int[0x100];

    std::cout << "Hello World!\n";

    _CrtDumpMemoryLeaks();
}
Below is how it works:

However, complex applications allocate memory in a different order. This makes an allocation number is useless to leaks debugging as the leaked memory block will get different allocation numbers on each run.
False positives
Another issue is that _CrtDumpMemoryLeaks is called before destructors of global objects. That is why it outputs memory block information, that will either freed later or not. _CrtDumpMemoryLeaks can’t help you if global objects allocate and free memory.
Visual Studio Extension to catch leaks
Fortunately, there is a better way to solve the problem. Deleaker is an extension for Visual Studio that assists a developer to debug leaks.
After installing, you will find a new menu item Deleaker in Visual Studio. Start debugging as usually. Deleaker immediately comes and suggests to monitor all allocations made by a process. Deleaker saves call stack and other information of each memory block.
While debugging, you can switch to the Deleaker window and take a snapshot to explore currently allocated objects. When a process quits, Deleaker automatically prepares a final snapshot that contains possible leaks. Thanks to Deleaker filters, the developer focuses on those leaks he is responsible for.
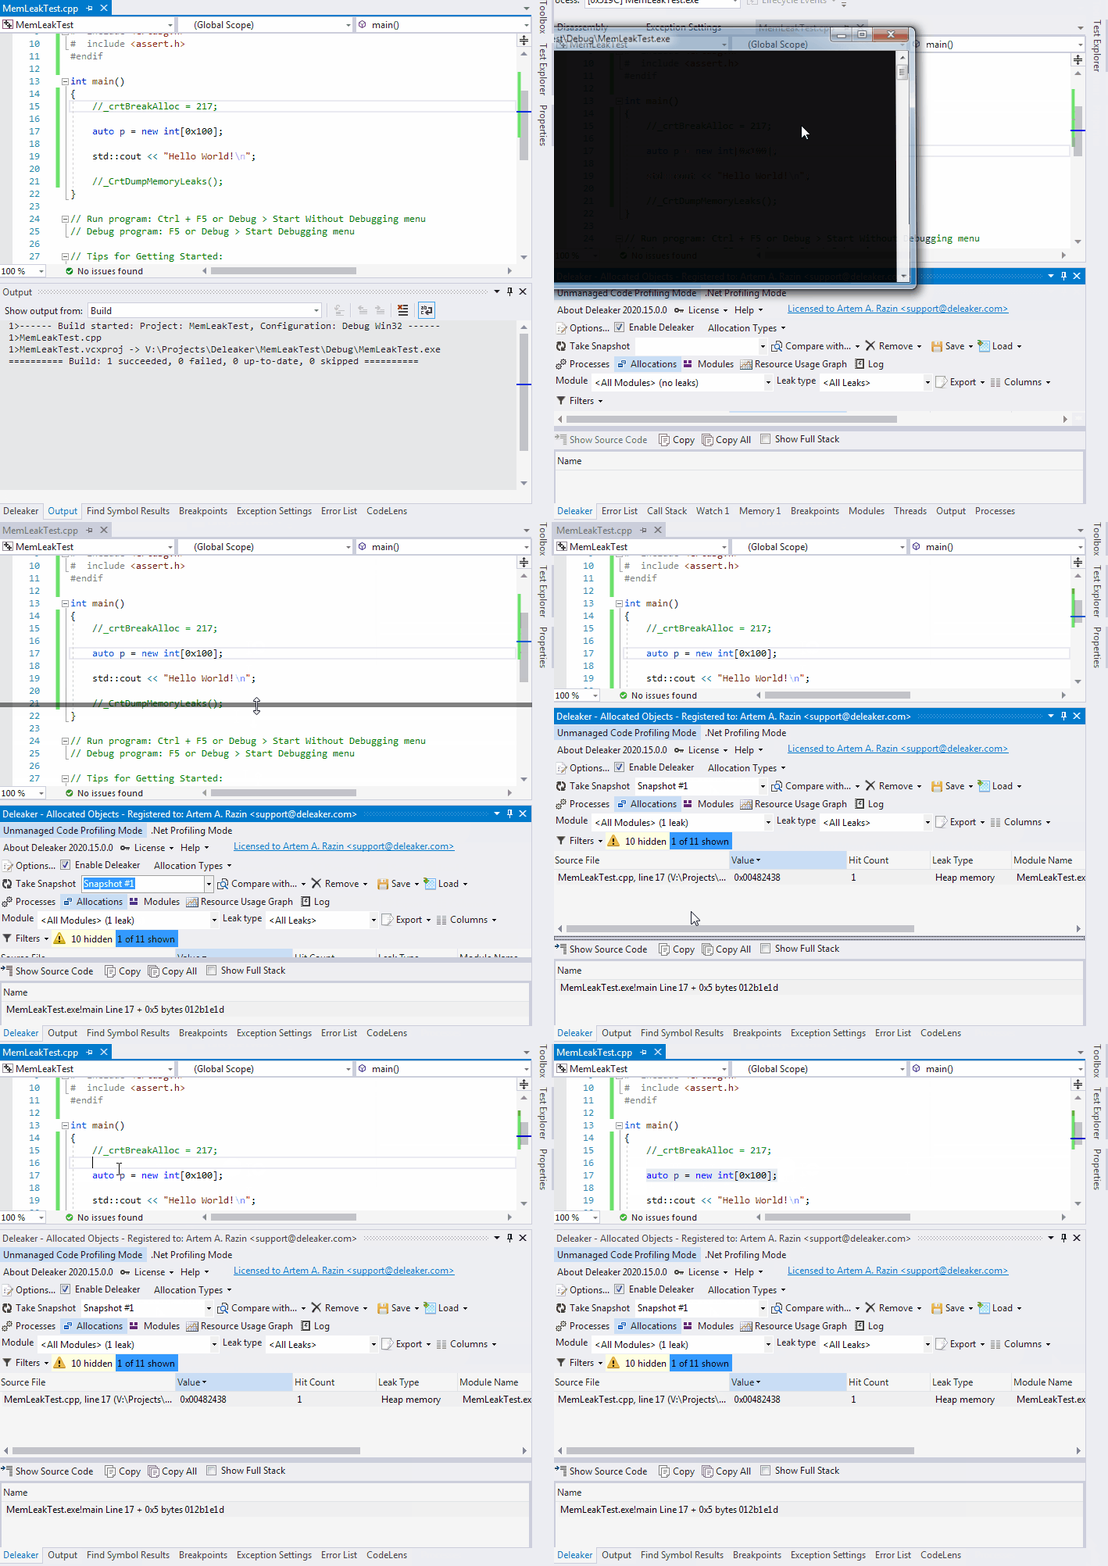
Return to the sample, and comment lines where you set _crtBreakAlloc and call of _CrtDumpMemoryLeaks. Rebuild the project and start debugging once again:

Deleaker has found a leak that was introduced, it correctly detected the exact line and the source file where the memory was allocated. You can review the call stack. Just double-click the allocation to navigate to the source code. The source file is opened in Visual Studio and you are ready to start working with the code.
Wrapping up
Some developers names Deleaker “a Valgrind for Visual Studio”. Indeed, you may consider Deleaker as an alternative for Valgrind that works on Windows and integrates with all major development environments including Visual Studio, C++ Builder, Qt Creator, and CLion.
CRT is not helpful in most cases as very often it doesn’t show call stacks, and its reports contain memory that can be freed later.
Instead of raw console output (both CRT and Valgrind doesn’t have any UI), Deleaker has a nice UI that helps quickly locate and fix memory issues, explore memory usage in real-time.
Deleaker snapshots make memory leak detection in Visual Studio comfortable: a developer just compare consequent snapshots to find spots that commit memory actively.
Also, while CRT is designed for memory allocated by C/C++ functions only (malloc, calloc, operator new and new[]), Deleaker detects all kinds of leaks such as GDI leaks, handles leaks and leaks made by COM.