Contents
- Introduction
- Examples of memory leaks
- How to fix memory leaks in a native C/C++ application
- Alternative tool: Deleaker
- Potential Issues
- Conclusion
Introduction
Memory leaks often happen in a C/C++ code, especially in big projects with a large legacy codebase. Such leaks may “live” for years if a colossal developer team maintains a project,having no chance to meet and fix it.
There are different reasons why memory-related bugs exist in projects. They vary, but the main ones are developer carelessness, the lack of skills or experience of native application development. Some developers that came to C++ from the managed world, Java, .NET, or JavaScript, believe that the operator delete is not strongly required, and the garbage collection does the job anyway. Well, sounds great, but C++ doesn’t have one.
No matter how experienced a developer is, memory leaks still happen. The process of finding memory leaks is usually mind-numbing. Several tools on the market help investigate leaks; some of them are free. This article will show how to fix memory leaks on Windows using the WinDbg application. Also, you will see how to use an alternative tool, Deleaker, a memory profiler for C/C++.
WinDbg is a part of the Debugging Tools for Windows. It’s a powerful debugger for both kernel and userspace from Microsoft and a great tool to find memory leaks. WinDbg can point at the code block in the most complicated cases, potentially the culprit of the memory leaks in your program.
Deleaker is a memory leak detection tool for Windows as well. It can work as a standalone tool or as a plugin in almost all popular IDEs: Visual Studio, Qt Creator, and RAD Studio.
The Visual Studio debugger and C++ Runtime memory diagnostics tools can often provide information about the origin of a memory leak. However, they are a bit awkward in use as they require access to the sources and sometimes need debug builds. This article doesn’t highlight this scenario. When a leak comes from an external module whose source code is unavailable, these tools just don’t work. In this case, we can rely on the WinDbg or Deleaker!
Imagine a big and complicated application, which is built from hundreds of thousands of lines of code. Moreover, you don’t have access to the source code. The process of locating the origin of memory leaks sounds like a challenging task. But don’t worry, as there are at least two ways out, and you’ll get them after reading this article.
You can download WinDbg from here. Deleaker is available on the official website.
Install both on your machine, and we’ll begin.
Examples of memory leaks
The common one
Let’s start with a simple and most common example. In this case, the memory gets allocated using the operator new in C++ (or using the malloc function in C). Still, it doesn’t have the appropriate call to the operator delete (or free in C). The code saves the pointer of the allocated memory block to a variable. The correct way is to use this variable to read and write data, and once the memory block is not required, to free it using the operator delete (or free in C). If the variable gets another value before freeing memory, there are no chances to free the memory:
void main()
{
    auto p = malloc(32768);
    memset(p, 0, 32768)

    //free(p)
    p = nullptr;
}
Here’s another case when the dynamically allocated memory doesn’t get free in all control paths of the function. For example, the function calls TestFunc(); in its turn, TestFunc allocates a memory block and should free it before the return. However, there are one or several conditions that should return from the function upon failure. Accordingly, in some circumstances, the code doesn’t free allocated memory:
void TestFunc(int value)
{
    auto p = new int[32768];

    if (value == 42)
    {
        //delete[] p;
        return;
    }

    delete[] p;
}

void main()
{
    TestFunc(42);
}
If the function is big enough, such memory leak is non-obvious and difficult to find and fix.
WinAPI’s implicit memory allocations
Let’s take a look at another example:
#include <windows.h>
#include <cstdio>

LPSTR GetFormattedMessage(LPCWSTR pMessage, ...)
{
    LPSTR pBuffer{ nullptr };

    va_list args{ nullptr };
    va_start(args, pMessage);

    FormatMessageW(
        FORMAT_MESSAGE_FROM_STRING | FORMAT_MESSAGE_ALLOCATE_BUFFER,
        pMessage,
        0,
        0,
        (LPWSTR)&pBuffer,
        0,
        &args);

    va_end(args);

    return pBuffer;
}

int main()
{
    auto pMessage = L"%1!*.*s! %3 %4!*s!";
    GetFormattedMessage(pMessage, 4, 2, "Pony", "Horse", 6, "Blah");
    return 0;
}
The flag FORMAT_MESSAGE_ALLOCATE_BUFFER causes FormatMessage to allocate memory. This memory should be released by the LocalFree function afterward to avoid a leak. If a developer is not very familiar with the Windows API, it is easy to forget this point. Also, it is worth mentioning that C++ Runtime won’t report such a leak. Fortunately, one can still find this leak using a technique discussed further in the article.
C++ classes inheritance
Another common source of memory leaks is the improper usage of virtual destructors in C++. It is important to remember that a base class must have a virtual destructor.
Imagine a derived class initializes std::vector member variable in the constructor. A destructor automatically executes destructors of member variables. So the derived class destructor calls std::vector::~vector(), which in its turn frees memory.
The operator delete, called on a base class pointer, doesn’t execute the derived class destructor if the base class one is not virtual. The operator delete calls only the base class destructor (the compiler places the destructor address to the generated code).
The following code snippet demonstrates the case:
#include <iostream>
#include <vector>

class BaseClass
{
public:
    /* virtual */ ~BaseClass()
    {
        std::cout << "BaseClass::~BaseClass()" << std::endl;
    }
};

class DerivedClass : public BaseClass
{
public:
    DerivedClass() : _buffer(16384) {}

    ~DerivedClass()
    {
        std::cout << "DerivedClass::~DerivedClass()" << std::endl;
    }

    std::vector<char> _buffer;
};

int main()
{
    BaseClass* p = new DerivedClass();
    delete p;

    std::cin.get();
    return 0;
}
If you run this code, you get:
BaseClass::~BaseClass()
As expected, DerivedClass::~DerivedClass() is not called. It is worth saying that a compiler doesn’t warn about such a case; thus such kind of bugs is widespread.
What happens if a base class doesn’t have a virtual destructor? A compiler knows that no virtual destructor is available and generates a code that calls the destructor of a pointer type, i.e. BaseClass::~BaseClass(). Let’s look at the disassembled code:
    delete p;
006D926D 8B 45 EC             mov         eax,dword ptr [p]
006D9270 89 85 08 FF FF FF    mov         dword ptr [ebp-0F8h],eax
006D9276 83 BD 08 FF FF FF 00 cmp         dword ptr [ebp-0F8h],0
006D927D 74 15                je          main+0D4h (06D9294h)
006D927F 6A 01                push        1
006D9281 8B 8D 08 FF FF FF    mov         ecx,dword ptr [ebp-0F8h]
006D9287 E8 A5 83 FF FF       call        06D1631h
à
006D1631 E9 4A 26 00 00       jmp         BaseClass::`scalar deleting destructor' (06D3C80h)
Make BaseClass::~BaseClass() virtual, rebuild and run. Now you get:
DerivedClass::~DerivedClass()
BaseClass::~BaseClass()
Let’s look at the generated machine code:
    delete p;
00D992BD 8B 45 EC             mov         eax,dword ptr [p]
00D992C0 89 85 08 FF FF FF    mov         dword ptr [ebp-0F8h],eax
00D992C6 83 BD 08 FF FF FF 00 cmp         dword ptr [ebp-0F8h],0
00D992CD 74 25                je          main+0E4h (0D992F4h)
00D992CF 8B F4                mov         esi,esp
00D992D1 6A 01                push        1
00D992D3 8B 8D 08 FF FF FF    mov         ecx,dword ptr [ebp-0F8h]
00D992D9 8B 11                mov         edx,dword ptr [ecx]
00D992DB 8B 8D 08 FF FF FF    mov         ecx,dword ptr [ebp-0F8h]
00D992E1 8B 02                mov         eax,dword ptr [edx]
00D992E3 FF D0                call        eax
This case illustrates that the virtual methods table stores the destructor address. Compare this code with the previous one, where the compiler has placed an exact destructor address.
The list of various causes of memory leaks in C++ seems to be almost endless, but now it’s time to move over to the ways of fixing them.
How to fix memory leaks in a native C/C++ application
Prerequisites
Before starting to find and eliminate memory leaks, we need to get some tools. Install the Windows SDK and Visual Studio. The Windows SDK comes with two important applications required to hunt leaks: Global Flags and WinDbg. Their default location is C:\Program Files (x86)\Windows Kits\10\Debuggers\x64 (or C:\Program Files (x86)\Windows Kits\10\Debuggers\x86). It is a good idea to add this path to the PATH environment variable for convenience. Also, you need a debug build of your application. Finally, we are ready to deal with the leaks.
Preparations
If you haven’t used the WinDbg debugger before, pay attention to making it work correctly. You need to choose the correct version – either 32 or 64-bit. A 32-bit version of WinDbg debugs 32-bit programs and 64-bit one – 64-bit programs. Otherwise, it won’t function properly because of the implementation specifics (x64 uses registers and stack for function arguments passing while x32 is only using stack), which will make it harder to find a leak.
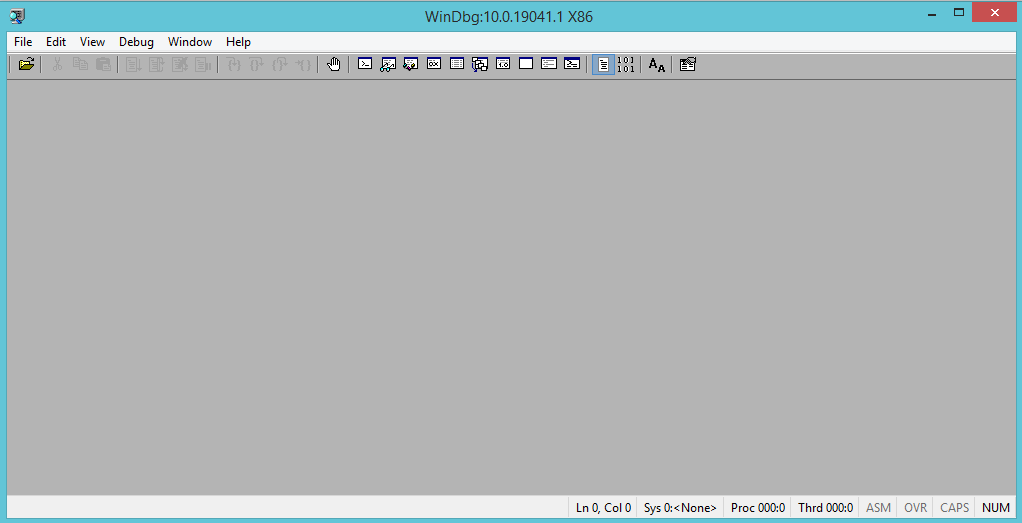
To start our work with WinDbg:
1. Set a path to the debugging symbols.
Open a File menu and select the Symbol File Path… option (or press Ctrl + S).
The following window appears:
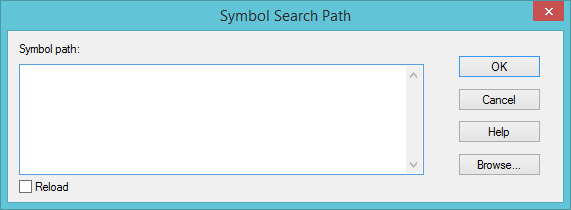
Enter the following string there (without quotes):
SRV*C:\symbols*http://msdl.microsoft.com/download/symbols
WinDbg will download symbols from http://msdl.microsoft.com/download/symbols and store them to C:\symbols.
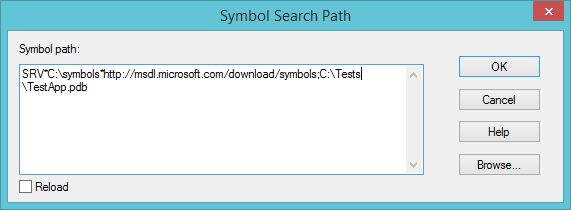
2. Add all the PDBs (program database) files of your executables and DLL libraries to the symbol paths list.
Press the Browse… button or print it manually, separating each entry with a semicolon symbol inside the same window from the previous step.
In the end, you should get the following:
3. You also need to set a flag to enable the user call stack for the application we need to debug. That’s easy and done using the gflags.exe. Launch the Global Flags (gflags.exe) application with admin rights because it modifies the system registry. Launch it and switch over to the Image File tab. Enter the application name and press the Tab key on your keyboard. Ensure that both Enable page heap and Create user mode stack trace database flags are enabled. These flags activate collecting information about memory allocations, which is very useful when looking for leaks. You can also use the command line:
gflags.exe /i TestApp.exe +ust

TestApp.exe is the name of your application.
For example, our demo application uses the following flags:
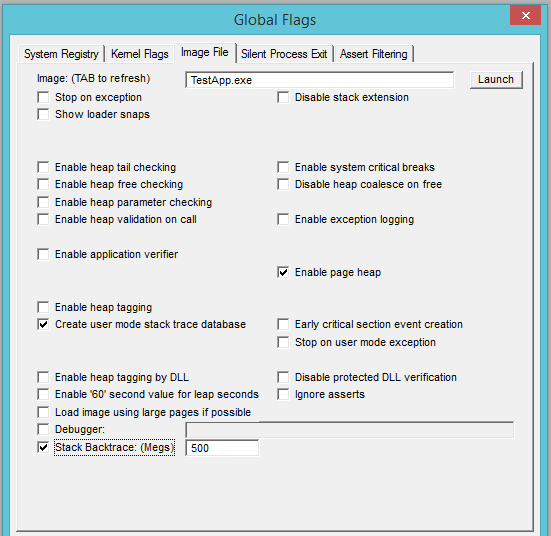
Don’t forget to press the Apply button to apply these flags on the debugging application; otherwise, there won’t be any effect.
Debugging
After we set up the paths to symbols in WinDbg, we can launch the leaking process, attach the debugger to it and start looking for the source of memory leaks.
WinDbg brings the debugging process to a new level. It’s a console application with a GUI shell, a powerful debugger, as long as you know the proper commands. This article contains all the exact steps and commands we need and which are detailed below.
First, launch the debug build of your application inside the debugger (Ctrl + E) or attach it to a running process of your application (F6). Both methods are also available from the File menu of the WinDbg window.
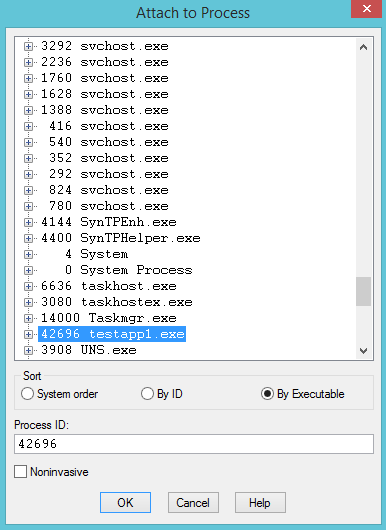
WinDbg launches a new process or attaches to a running one, and right after that, it breaks the program’s execution. It’s high time to set a breakpoint to prevent the program from closing and losing the essential diagnostics information, which will help us find the leak source. Enter this into the command line:
bu ucrtbased!_CrtDumpMemoryLeaks

The bu command sets an unresolved (deferred) breakpoint on _CrtDumpMemoryLeaks function from ucrtbased.dll. This function creates a memory leaks report, which one can see inside the output window of the WinDbg (or Visual Studio). We need to stop the execution soon after this function call. To preserve allocation-related information, set a breakpoint here, as the actual important function call is just a couple of function calls further. Continue the program execution by selecting Go in the Debug menu or pressing the F5 key on your keyboard. It’s also possible to enter the g command into the command line and hit Enter after that.
Do all the required steps inside the application, which causes the memory leak, and then just shut it down. The debugger will halt the execution when it reaches the _CrtDumpMemoryLeaks function call. Now enter the pc command exactly four times to get the actual memory leaks report, which is available in the output window of the WinDbg. The pc command is responsible for performing the step to the following function call. The last function call leads directly to a memory leaks report generation inside the debugger output window:
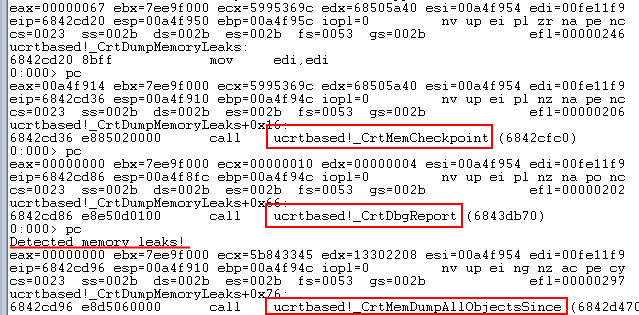
As a result, we have the memory leak report so we can start our investigation. The critical information here is the memory addresses pointing to the leaked memory blocks. Having the address of the leaked memory, we can use the power of WinDbg to get the call stack of each particular memory allocation.

Copy the complete memory address (including 0x) from the WinDbg output window. As an example, use the image above displaying the output from the WinDbg with a memory allocation {148}; the address will be 0x133E0FF8.
Enter the following command into the debugger’s command line:
!heap -p -a 0x133E0FF8

The execution will take a couple of seconds. After that, you’ll receive the call stack of the memory allocation with the leaked memory block. Use the !heap command to display memory heaps of the process.
Here’s the example of the !heap command execution:
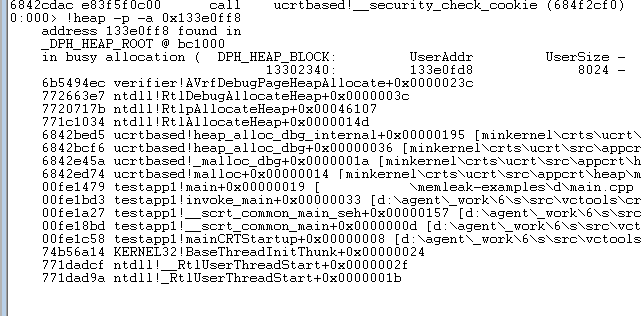
In this example, the source of the memory leak is the main function itself. It allocates a memory block of 32Kb in size and doesn’t free it up afterward, which is the leak’s culprit. The !heap command output also contains the source file name and a line number (after the @ symbol), representing the exact line where the code allocates a memory block. So all we need to do now is to execute the !heap -p -a addr command for each address with a memory leak from the report, and we’ll know the exact location of all the leaks in the code.
Sometimes it just doesn’t work.
There are some cases when the described method is non-efficient. The C Runtime doesn’t find a memory leak and doesn’t generate a memory leak report (or doesn’t mention the leak inside it), even though there is a leak in the code. In this case, we can use another technique: checking the heap allocation sizes. For example, in the second example shown above, the call to FormatMessage with the FORMAT_MESSAGE_ALLOCATE_BUFFER flag allocates a memory buffer internally to store the formatted string inside it. The user code is responsible for realizing explicit memory after the string is not required anymore by calling the LocalFree function. However, the absence of such a call causes some memory leaks. The C Runtime doesn’t detect this leak because the LocalAlloc function allocates memory inside FormatMessage (the C Runtime knows about leaks made by malloc, calloc, operator new, etc.). Of course, the leak size is not that big, and it happens once, but, for simplicity, let’s pretend that the code calls the FormatMessage in a loop, so it leaks memory every time we call it.
First, allow the program to execute for some time and then break it using the Debug – Break menu entry (or pressing the Ctrl + Break keys). WinDbg pauses the execution of the program. Let’s check the heap sizes now. Enter the !heap -stat -h 0 command to output stats for each heap that the application is using:
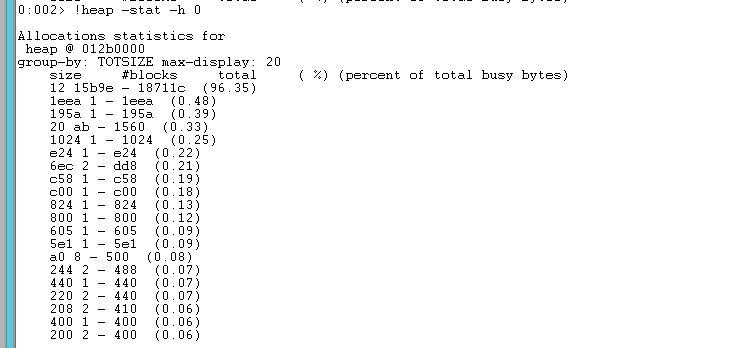
As you see, the report groups the allocations by their size. The highest one is the 12 in hex or 18 bytes. There are many of them in the application, and these allocations occupy 96 percent of the heap space. Let’s filter the allocations by this size using the !heap -flt s 12 command:
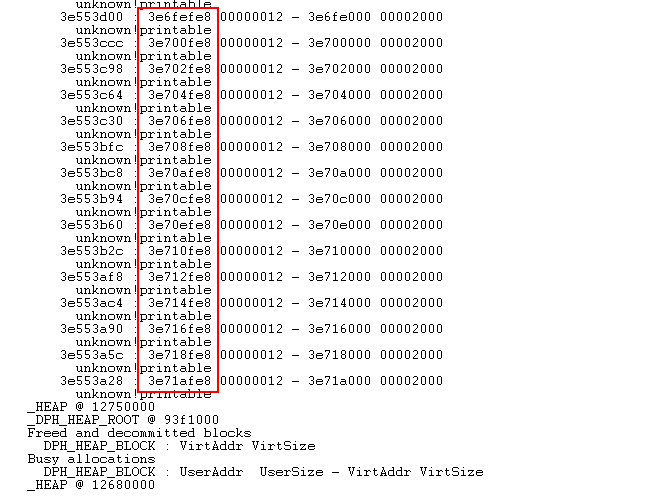
There’s the whole bunch of allocations of the same size, which might indicate a memory leak. Let’s see the origin of these allocations by checking the heap address (!heap -p -a addr) and using any entry from the column highlighted in red above as an address:
You can find a video tutorial below:
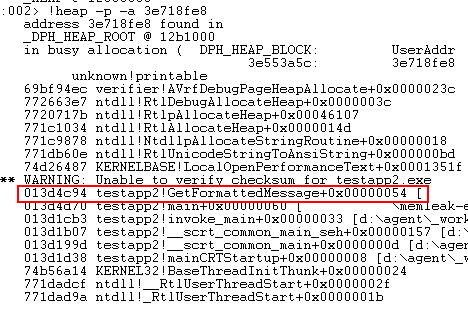
Great! Here’s the memory leak! Of course, it might not be that easy in a real-world application, but, as you see, it’s still possible to find such a kind of memory leak, and that’s better than nothing, right?
Alternative tool: Deleaker
WinDbg is a tool that works mainly in a console mode: a developer enters commands, like bu, and then receives some output. You need to use gflags.exe to force creating a database of stack traces. Unlike WinDbg, Deleaker is not a console tool; it has a friendly UI that helps explore all allocations along with their call stacks. Also, Deleaker doesn’t need gflags.exe: you just run an application without any preparations. It is worth saying that Deleaker can work as a Visual Studio extension, so a developer doesn’t need to quit his favorite IDE to debug leaks.
Deleaker has an intuitive UI: developers don’t need to know an infinite list of commands to type them repeatedly, hoping to find an address of leaked memory. Just take a snapshot and explore it. If memory usage grows, take several snapshots and compare them. Sounds better than typing !heap -p -a, doesn’t it? Of course, you can export snapshots to review them later or send them to another member of your team.
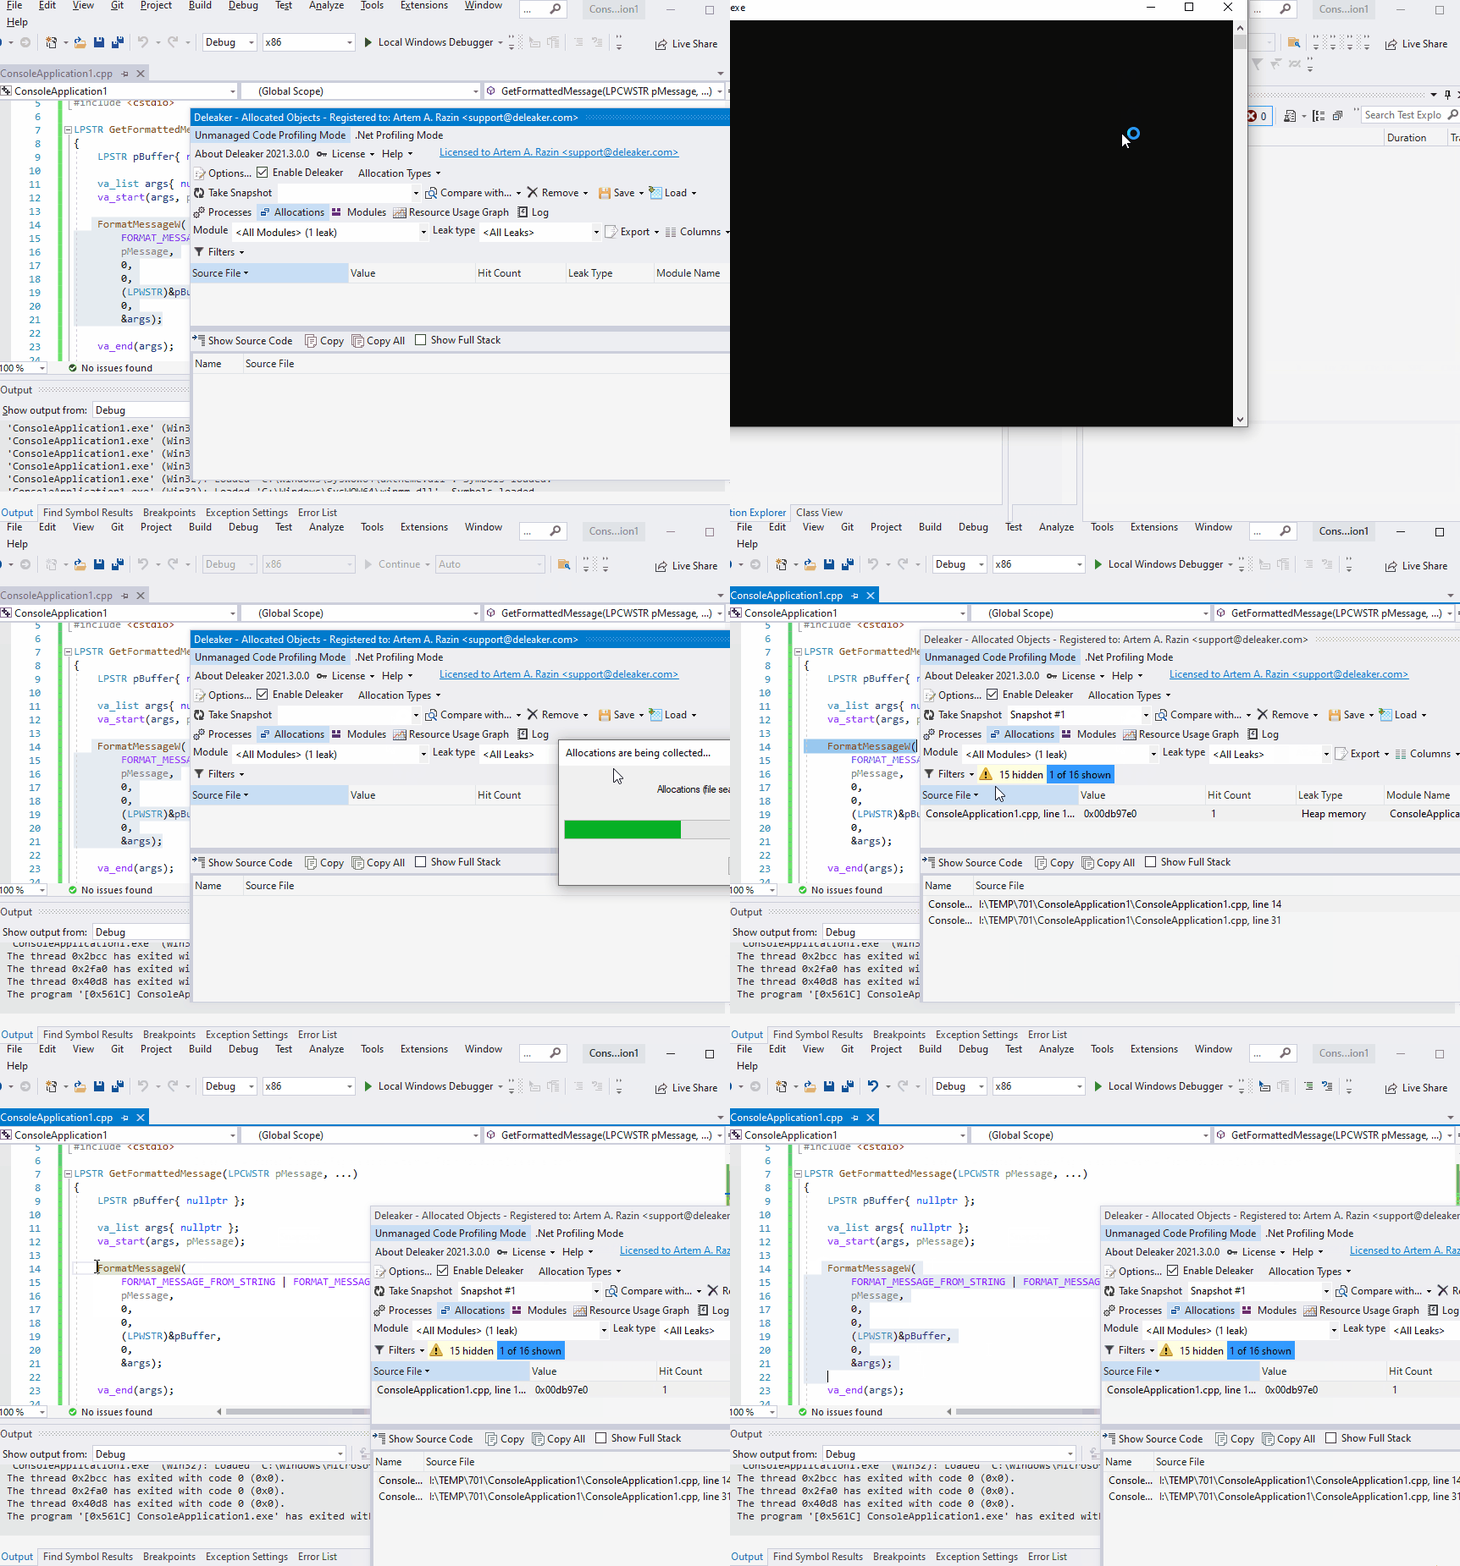
Want to see Deleaker in action? Well, remember that sample where FormatMessageW leaked. It has been hard to find the leak source with WinDbg because this leak was lost among other allocations. With Deleaker, it is convenient to find such a leak without leaving Visual Studio. Just enable Deleaker (Extensions – Deleaker – Enable Deleaker), start debugging as usual, and explore the Deleaker report that it creates on the application exit:
You can find a video tutorial below:
Potential Issues
The process of setting up your machine for a proper call stack of memory allocations generation in WinDbg is pretty easy, though there are some potential problems, which might happen to you during it. The solutions to such issues are below.
Inaccurate line number inside the source file
Sometimes the line number inside the memory leak report may be inaccurate. Usually, the difference is just a single line but can be more than one in rare cases. Most of the time, the correct line number inside the source file is less by one than the number you get from the report.
Multiple debuggers
You can attach WinDbg to a process that is already another debugger attached to, for example, Visual Studio debugger or another instance of WinDbg. The thing is, only one of them can have full access to the process at once; all other debuggers will have limited access to it. It will be possible to communicate with the process from inside the WinDbg, but it will be no chance to continue the process execution. All connected debuggers must be detached from the process before it resumes its execution.
Deleaker can’t attach to a process being debugged by another debugger. It requires exclusive access to a process.
Missing call stack
The most complicated thing that might happen to you is if the command !heap -p -a addr won’t create a call stack. The command is the primary way of memory leak detection in WinDbg to look at the call stack of memory allocations. Without having the stack, the process of memory leak elimination gets much harder or straight-up impossible. Usually, it is enough to set the required flags for the application by gflags.exe. Launch it and enter the application name (only the application name itself without the full path to it, that’s important!) into the Image field located inside the Image File tab. Enable the Stack Backtrace flag. For the backtrace size, it will be acceptable to set it to 500Mb or a bit higher. Don’t forget to press the Apply button after that to apply the changes.
Deleaker doesn’t need gflags: Deleaker saves stack traces to its own database.
One can’t find a leaked memory block by its allocation size.
When you are trying to detect a memory leak by its allocation size, there is a high risk that you won’t see it in the list by default. It happens when the leak size is small, or it occurs rarely. In such cases, the default output of the !heap -stat -h heap might not display the allocation as it is too small. To see it, we need to tell the !heap -stat command to display more entries. We can do that by appending the -grp argument. That means we group the allocation by some criteria. For example, !heap -stat -h heap -grp A 0n100 will group the entries by allocation size and display 100 of them instead of 20. The command also shows a lot of smaller allocations and, potentially, the leaked one.
In Deleaker, a developer can sort allocations but their size and hit count. The filters also can hide allocations made by some modules.
Conclusion
Memory leak detection is a cumbersome and time-consuming process. However, having the right tools, it becomes possible to discover virtually any memory leak. With some effort, one can reduce the number of memory leaks or eliminate them even in the most complex native application with a massive codebase.