Deleaker Help >> Usage
Getting started
There are two versions of Deleaker: Deleaker Add-in and Deleaker Standalone. Deleaker Add-in is installing into Visual Studio. Visual C++ 7.0, 8 is supported. Deleaker Standalone is compatible with all versions of Visual C++, including VC++ 6. Deleaker Add-in isn't installing into Visual C++ 6.0. With VC++ 6 use Deleaker Standalone.
To activate Deleaker Add-in, use main menu of Visual Studio:

To launch Deleaker Standalone, use Start Menu -> Programs -> Deleaker for Visual C++ -> Deleaker Standalone.
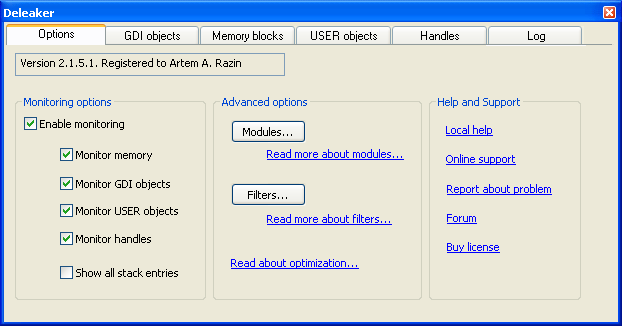
Deleaker is a panel with a few tabs:

On the first tab Options you:
- enable / disable monitoring
- set leak types you want to detect
To debug using Deleaker Add-in: enable monitoring, set other options and start debugging.
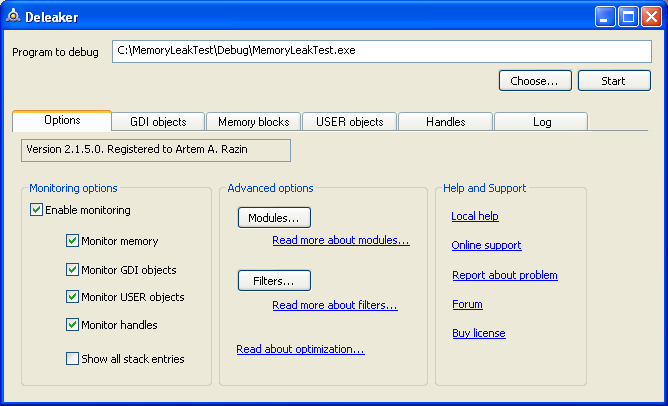
To debug using Deleaker Standalone: select an application (EXE), enable monitoring, set other options and click to Start:

About modules and filters see Modules and Filters.
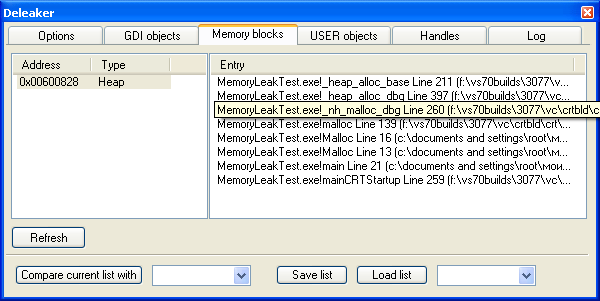
In any moment, during debugging or after exiting an application or ending it, you can get the list of allocated memory blocks, GDI / USER objects and handles. Go to the appropriate tab and click on Refresh:

About object snapshots ("Compare current list with" and so on) see Snapshots.
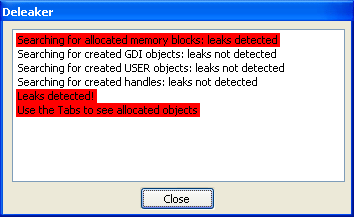
As soon as the debugging is finished, you'll see the dialog with the results:

After that go to the appropriate tab and explore objects / stacks.