How to detect leaks in C++ Builder
Introduction
This tutorial explains how to find memory leaks in C++ Builder without leaving the IDE. Also you will find how to navigate to the source of leaks and compare snapshots in order to find the leaking code.
Despite using modern techniques like RAII and smart pointers, it is still possible to have memory leakage even if raw memory allocation functions such as malloc, calloc, new and delete, are not used: for example, circular references of smart pointes make leaks easily. For old projects it is typical that legacy code just can't be rewritten in modern C++, and at the same time it leaks and it must be fixed immediately.
Installation
Deleaker is available as a standalone memory profiler, and as a plugin for C++ Builder.
It happens that leaks can be reproduced on a client machine, but not on a developer's one. The standalone Deleaker is developed for such cases.
For every day development process use Deleaker as a plugin for the IDE. Once Deleaker is integrated with C++ Builder, you can take memory snapshots and explore leaks while debugging without leaving the IDE.
Deleaker can work as a plugin in all versions of C++ Builder starting with C++ Builder 2010. If you use C++ Builder 6.0, use Deleaker standalone to find leaks.
Deleaker installer detects what versions of C++ Builder are available and integrates Deleaker plugin to the installed versions.
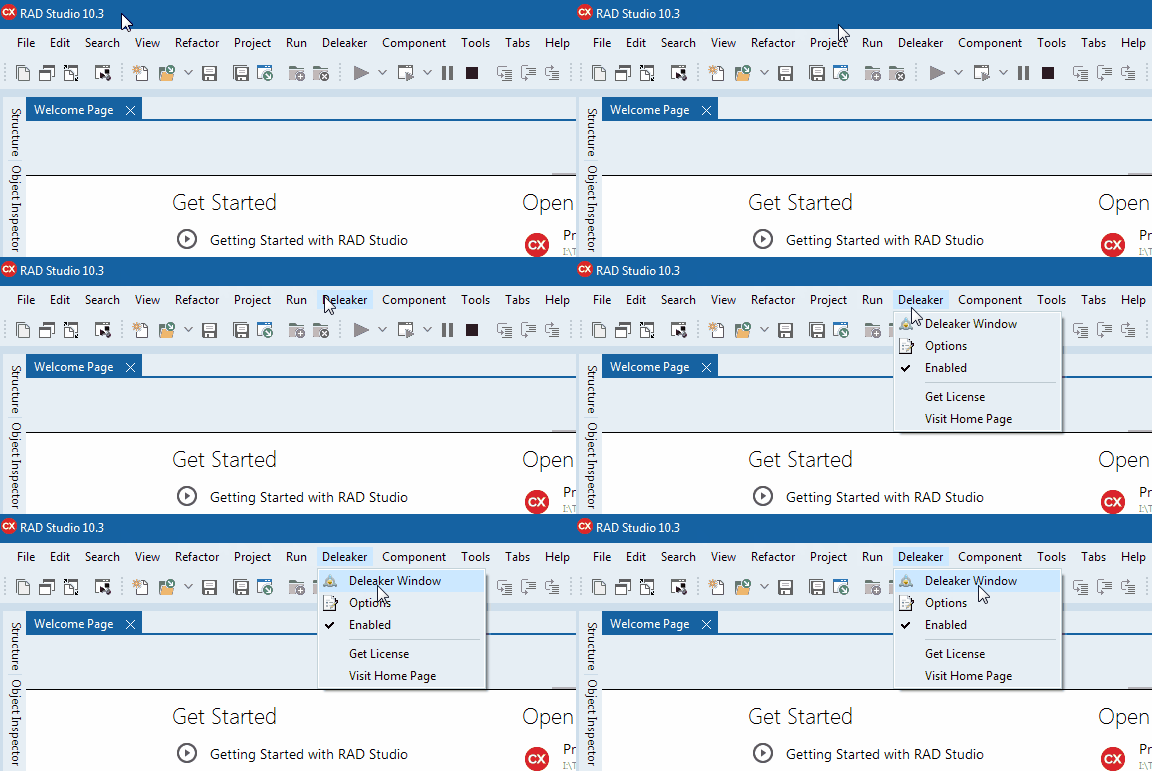
After Deleaker was installed, launch RAD Studio and you will see new menu item, Deleaker. To open Deleaker, click to Deleaker - Deleaker Window. By default, Deleaker is enabled and ready to profile memory leaks. To disable or enable Deleaker, use Deleaker - Enabled:
Introducing a memory leak
Let's create a new Windows VCL Application, drop a button to a form, and add a leak to OnClick event:
void __fastcall TForm1::Button1Click(TObject *Sender)
{
    int* p = new int[1024];
}
Project setup
Despite Deleaker profiles any application (no matter how it was built), it is better to setup a project to achieve more comprehensive results.
Debug information
The most important thing is enabling debug information. Debug information helps Deleaker resolve addresses, i.e. extract source file path and line number for an address, so a developer can easily understand where a leak occurred.
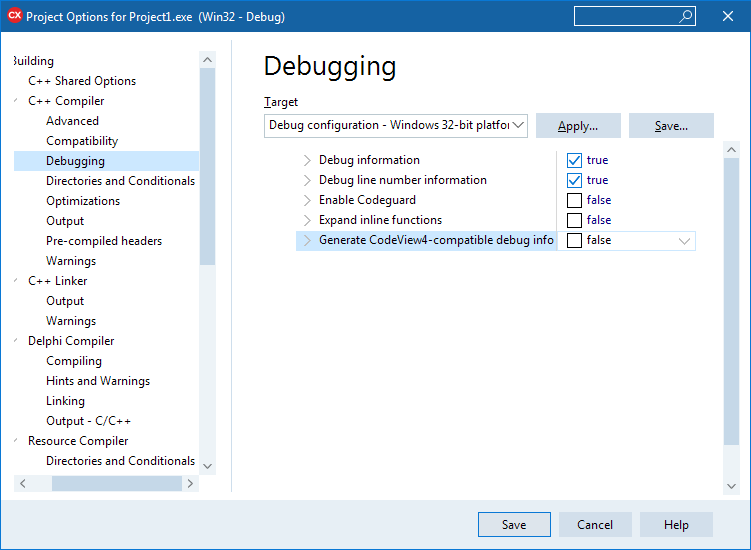
To enable generating debug information, click Project - Options..., then C++ Compiler - Debugging, set both Debug information and Debug line number information to True.
Also it is a good idea to ensure that Enable Codeguard is set to False:
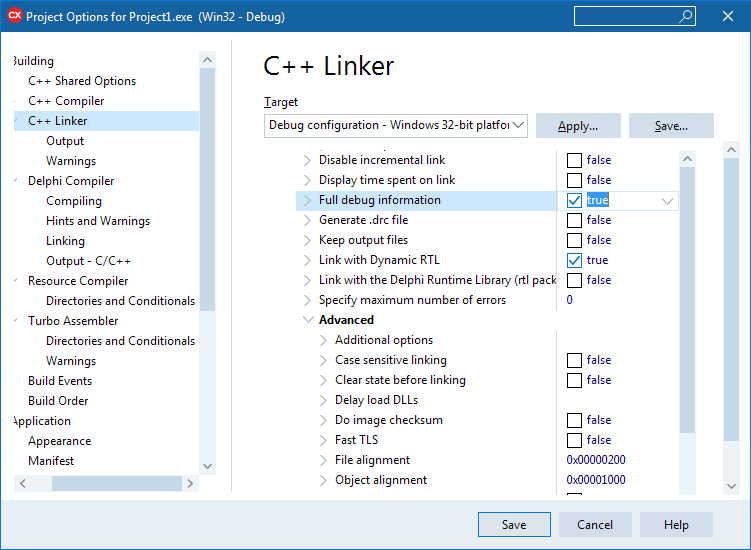
To tell a linker generate full debug information open C++ Linker and set Full debug information to True:
If you build a project from the command line, use compiler switches -v and -y.
Stack frames
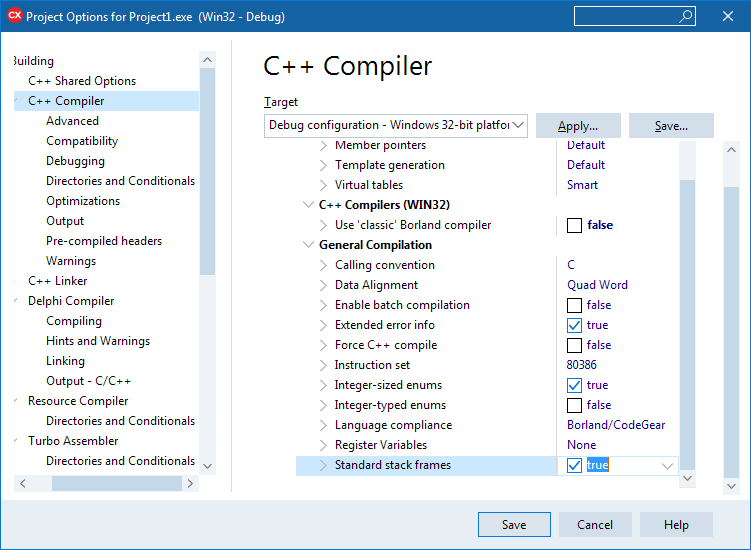
When memory is allocated, a Deleaker's hook saves call stack. To get information about all callers Deleaker needs stack frames. To enable stack frames generation set C++ Compiler - General Compilation - Standard stack frames to True as shown below:
If you build from the command line, use compiler switch -k.
Disable optimization
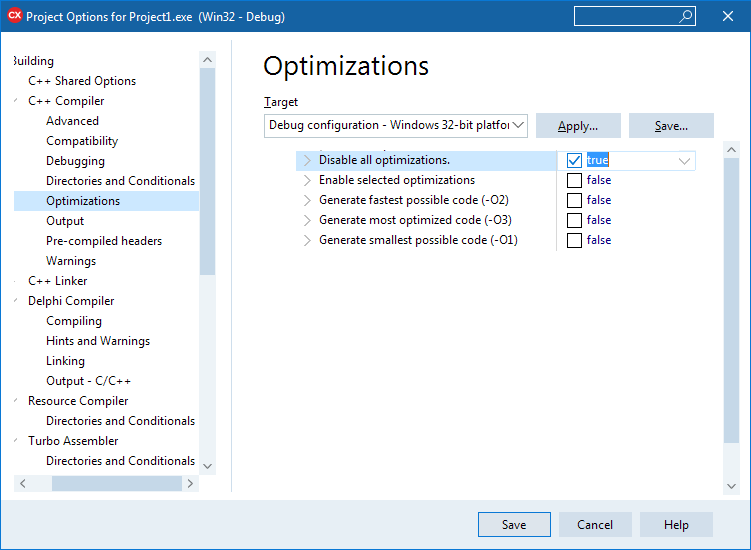
Deleaker is able to detect leaks of any executable, no matter what build configuration has been used. To get more accurate and clear information about allocations it is better to disable all optimizations. To do that open C++ Compiler - Optimizations, set Disable all optimizations to True:
Get memory leaks
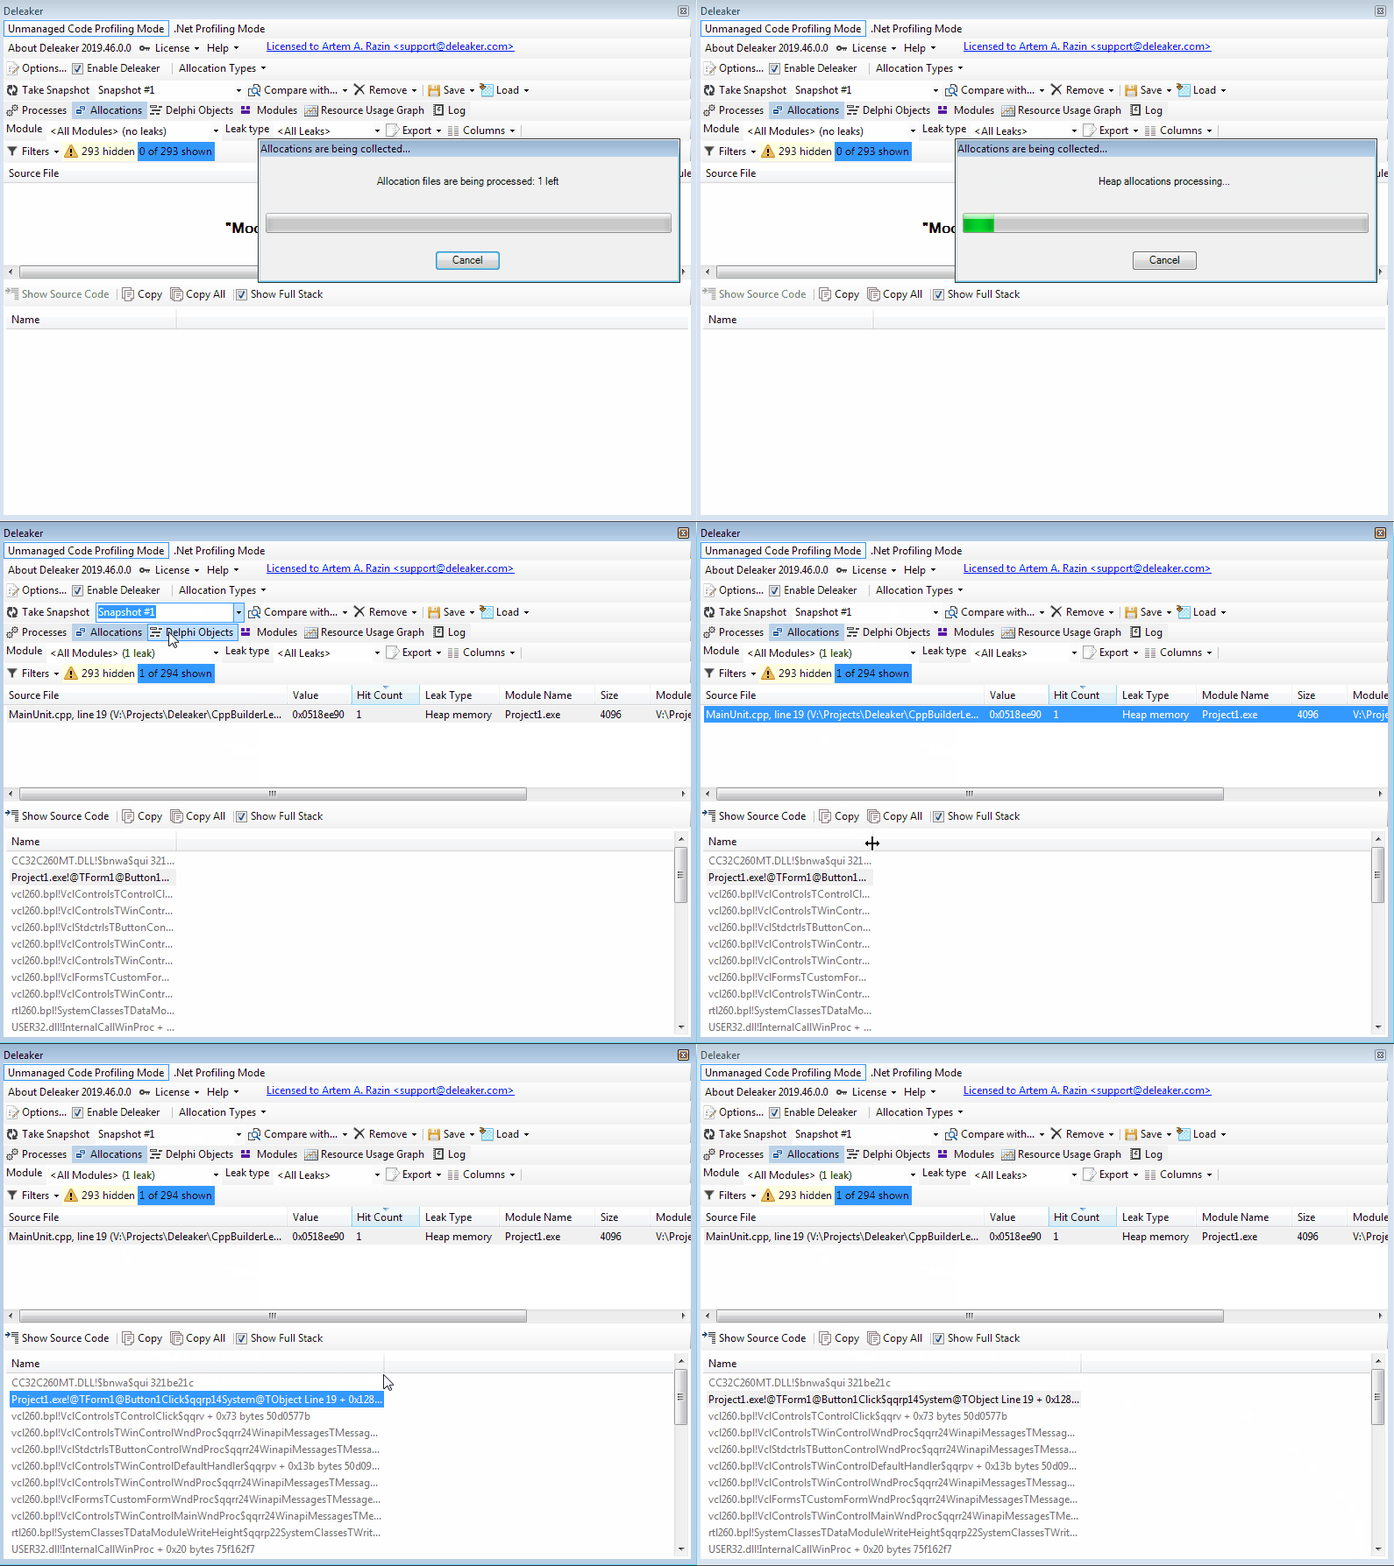
Once the project options are set to help Deleaker collect the most comprehensive information about leaks, build it and run. The form with the button is shown. Click the button to make a leak, and close the form. If Deleaker is enabled, once the process exits, Deleaker takes a snapshot that contains all allocations that were not freed. We call such allocations as leaks. The intentional leak is shown:
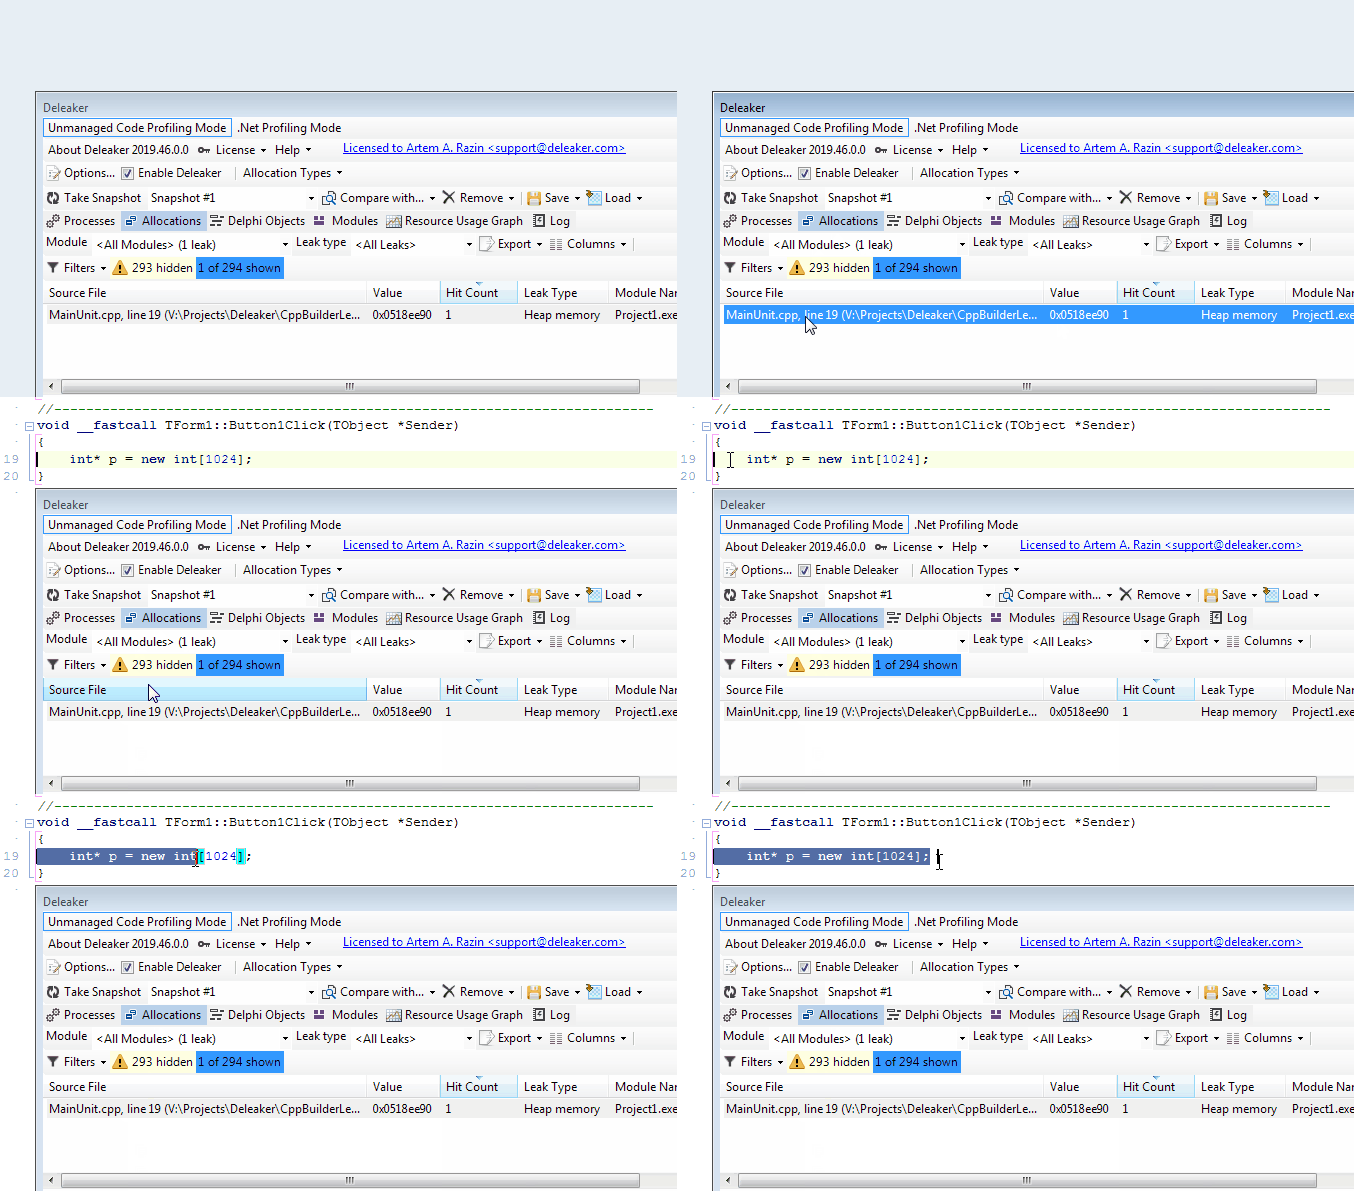
To navigate to the code that is responsible for a leak, double-click to an allocation entry, or right-click to any call stack entry and select Show Source Code. The corresponding source file is opened in C++ Builder at the line where the leak is made:
Fix permanent memory leakage
Sometimes you may notice that a process uses more and more memory. It is likely that there are some places in the code that get memory and that are called again and again. The question is whether such behavior is expected or not, but anyway a developer has to find such places.
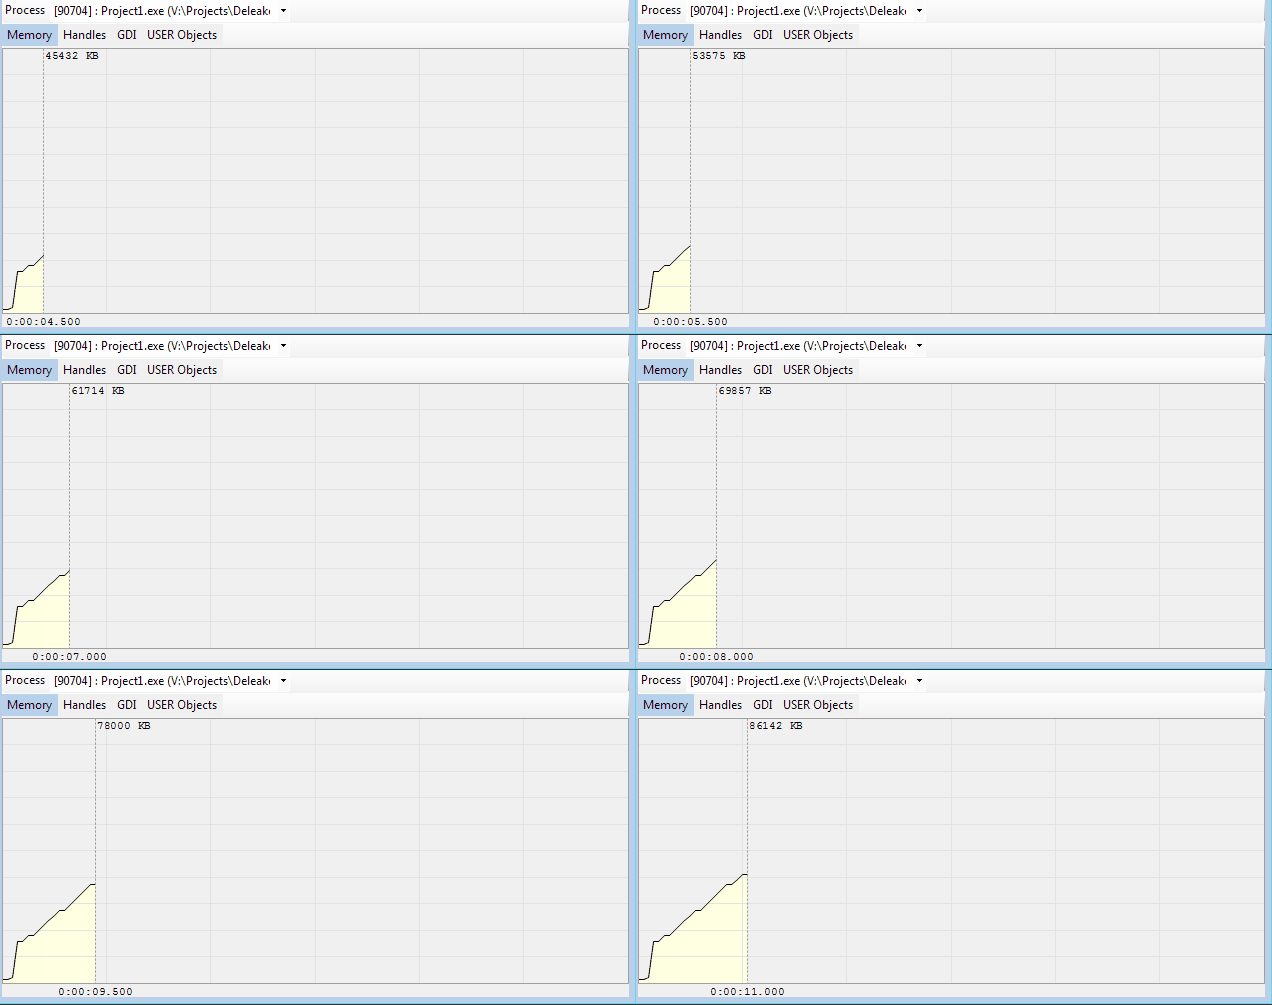
First of all it is worth to say that it is easy to look at memory usage right in Deleaker Window. Just switch to Resource Usage Graph while debugging. You will see something like the following:
Let's add a permanent memory leakage. Drop a timer to a form, enable it, set Interval to 500 ms, and allocate some memory at the timer's event OnTimer:
void __fastcall TForm1::Timer1Timer(TObject *Sender)
{
    int* p = new int[1000000];
}
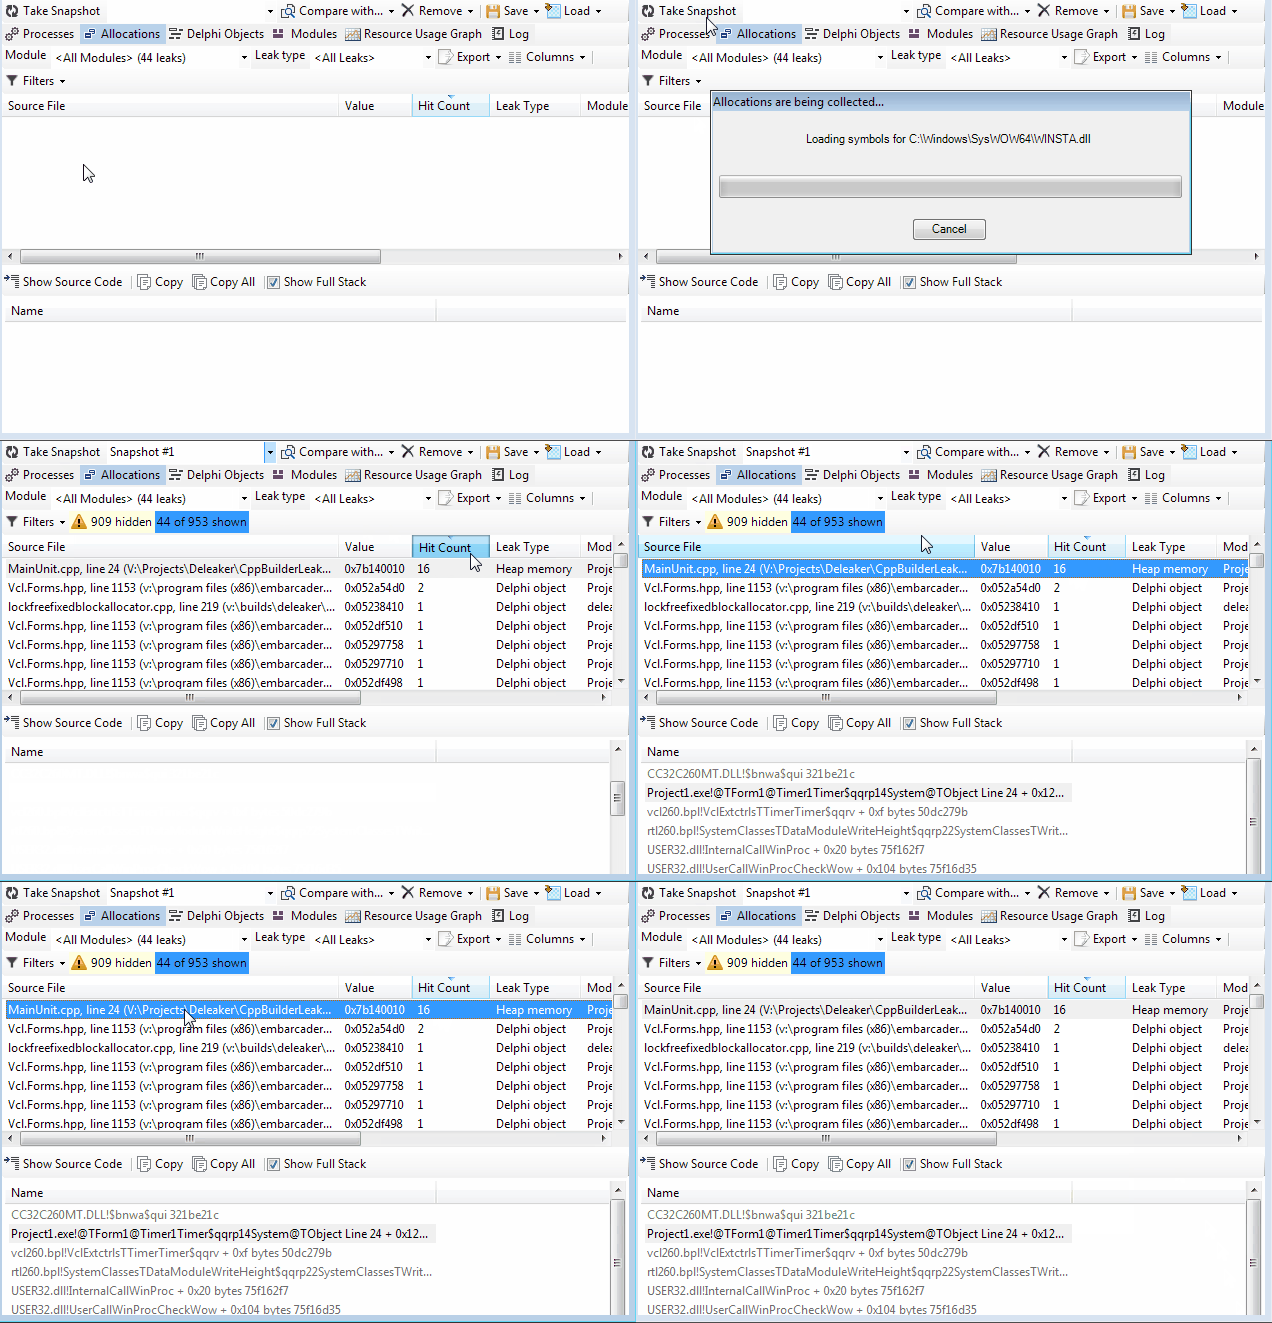
Build the project and run. Keep the process running, switch to Deleaker and click to Take Snapshot. You will see currently allocated memory and other resources. Look at the Hit Count column. It shows how many allocations are made at the same place with the same callers. Thus it is easy to identify resources that are allocated at the same place a lot of times, and Hit Count shows how many times. Thus Hit Count helps fix permanent memory leakage:
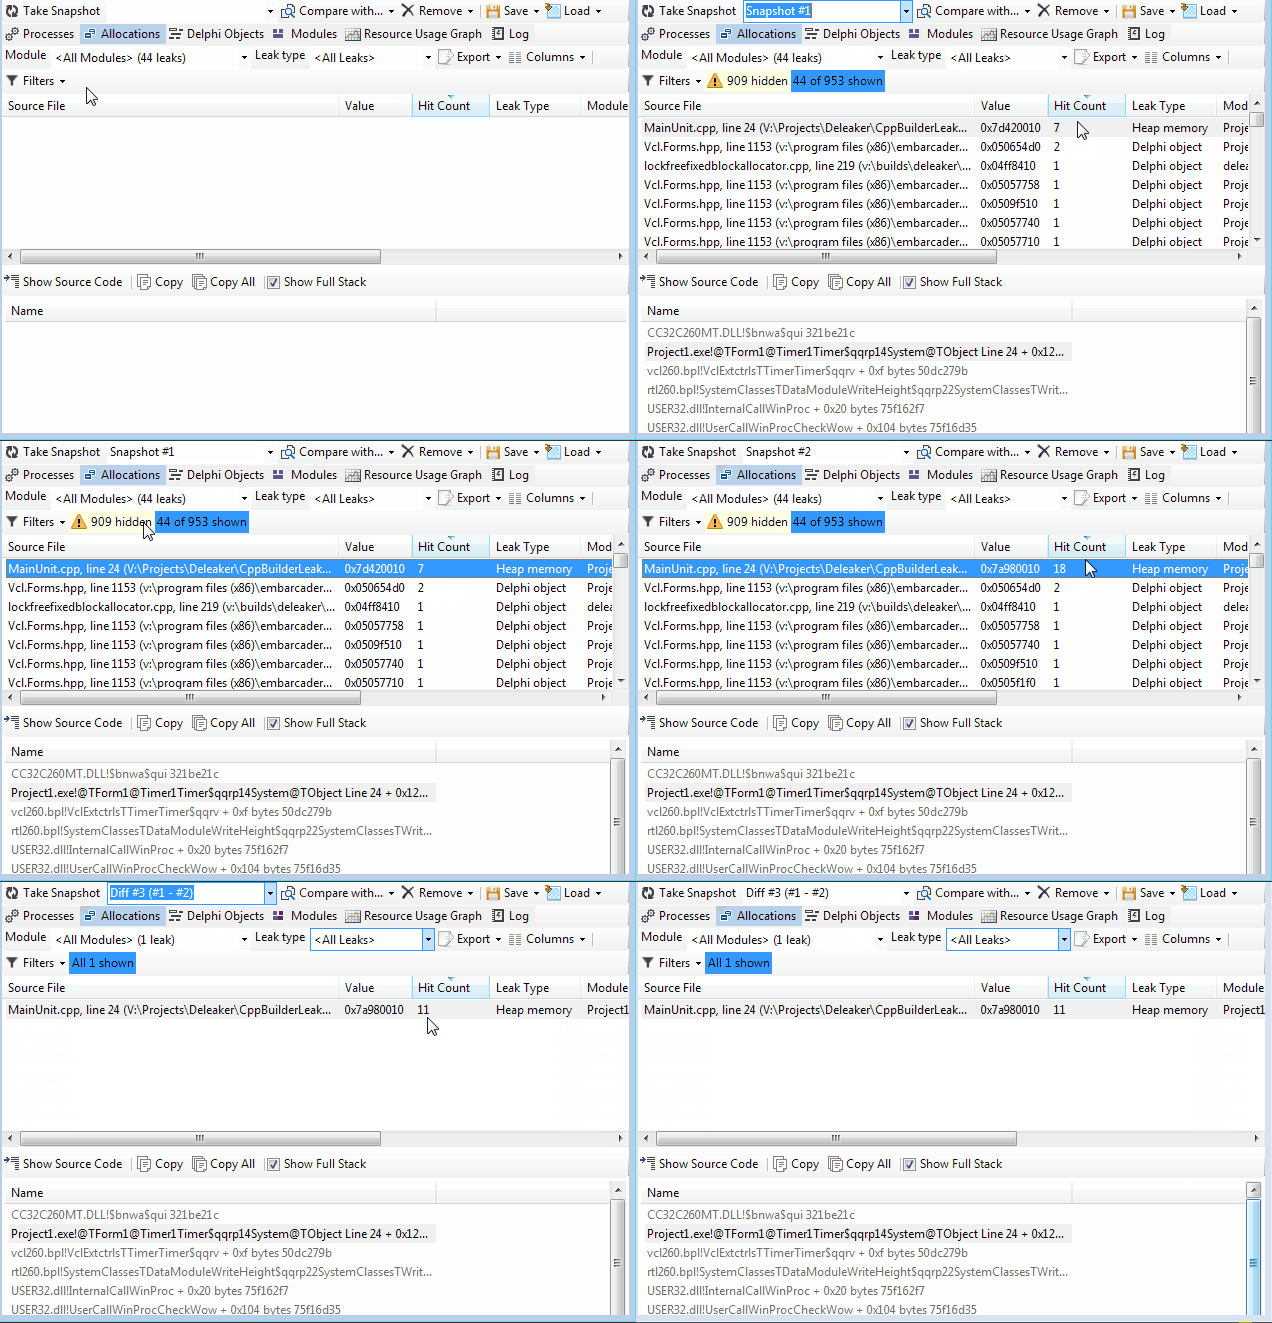
There is another way to detect such leaks. Two snapshots are taken, and then compared, so you see only those allocations that was made between moments when the snapshots were taken, i.e. only accumulated allocations. To compare snapshots select the first snapshot, then click to Compare With... and select another snapshot:
VCL Objects Leaks
Almost always C++ Builder code creates and uses VCL objects. A developer has to explicitly remove such objects; it is easy to forget to dispose them however. We may say that leaks of such objects are the most frequent kind of leaks if a program is written in C++ Builder.
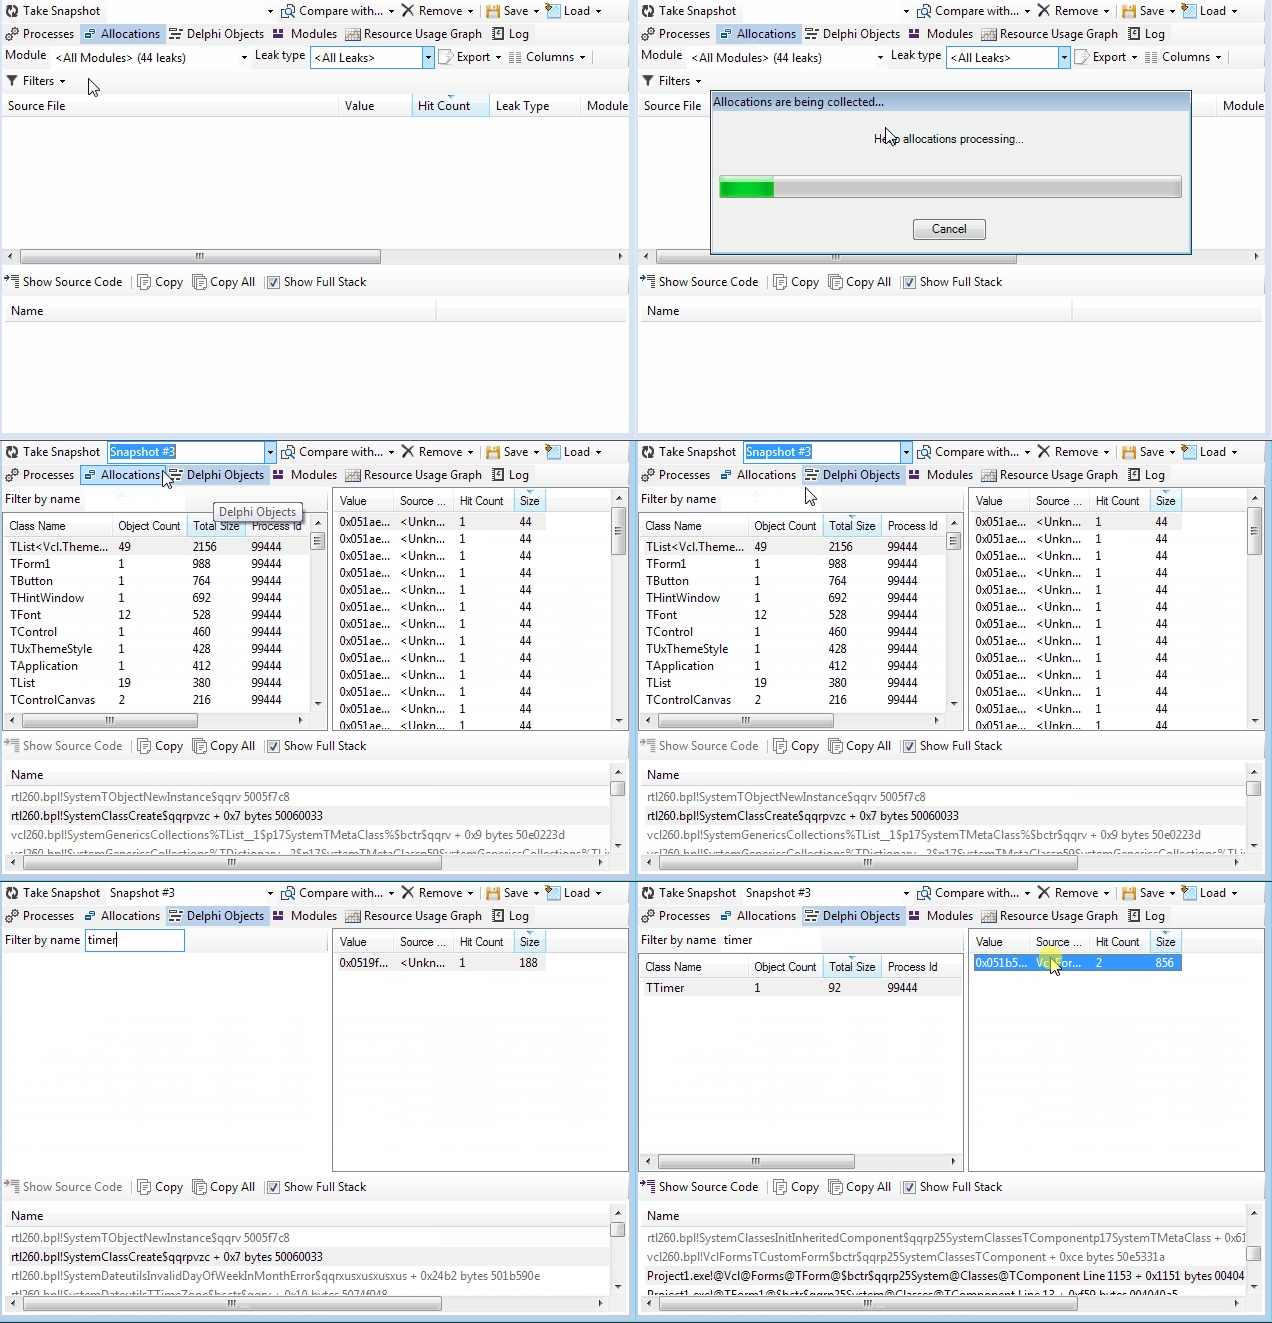
That is why Deleaker provides list of such objects. To explore them switch to Delphi Objects.
Objects are grouped by their classes, for each object a complete call stack is available. For each class a number of created objects are shown along with total size, so it is possible to find the largest ones. To locate objects of a particular class quickly just start typing its name at the edit box to the right of Filter by name:
Conclusion
Memory leak detection is not a simple task even if a code is clean and a C++ developer follows the modern standards. A code written in C++ Builder tends to use VCL objects that are traditionally allocated and disposed explicitly. It is easy to make an accidental leak.
That is why a memory profiler such as Deleaker is a very important tool for every developer nowadays.
Deleaker is tightly integrated with C++ Builder. It offers a comfortable way to explore allocated memory, VCL objects, GDI resources. Being a universal memory leaks detection tool, Deleaker works with 32-bit and 64-bit applications, and supports both modern frameworks including Firemonkey, as well as traditional VCL.