How to find memory leaks in Qt?
In this tutorial you will find how to check C++ memory leaks in Qt with the help of Deleaker.
Deleaker can work either as a standalone application, or as a Qt Creator plugin. Deleaker Standalone is convenient, for example, if Qt Creator is not available.
If Deleaker works as a plugin, a developer can find leaks without leaving Qt Creator in order to move to the source of possible errors quicker.
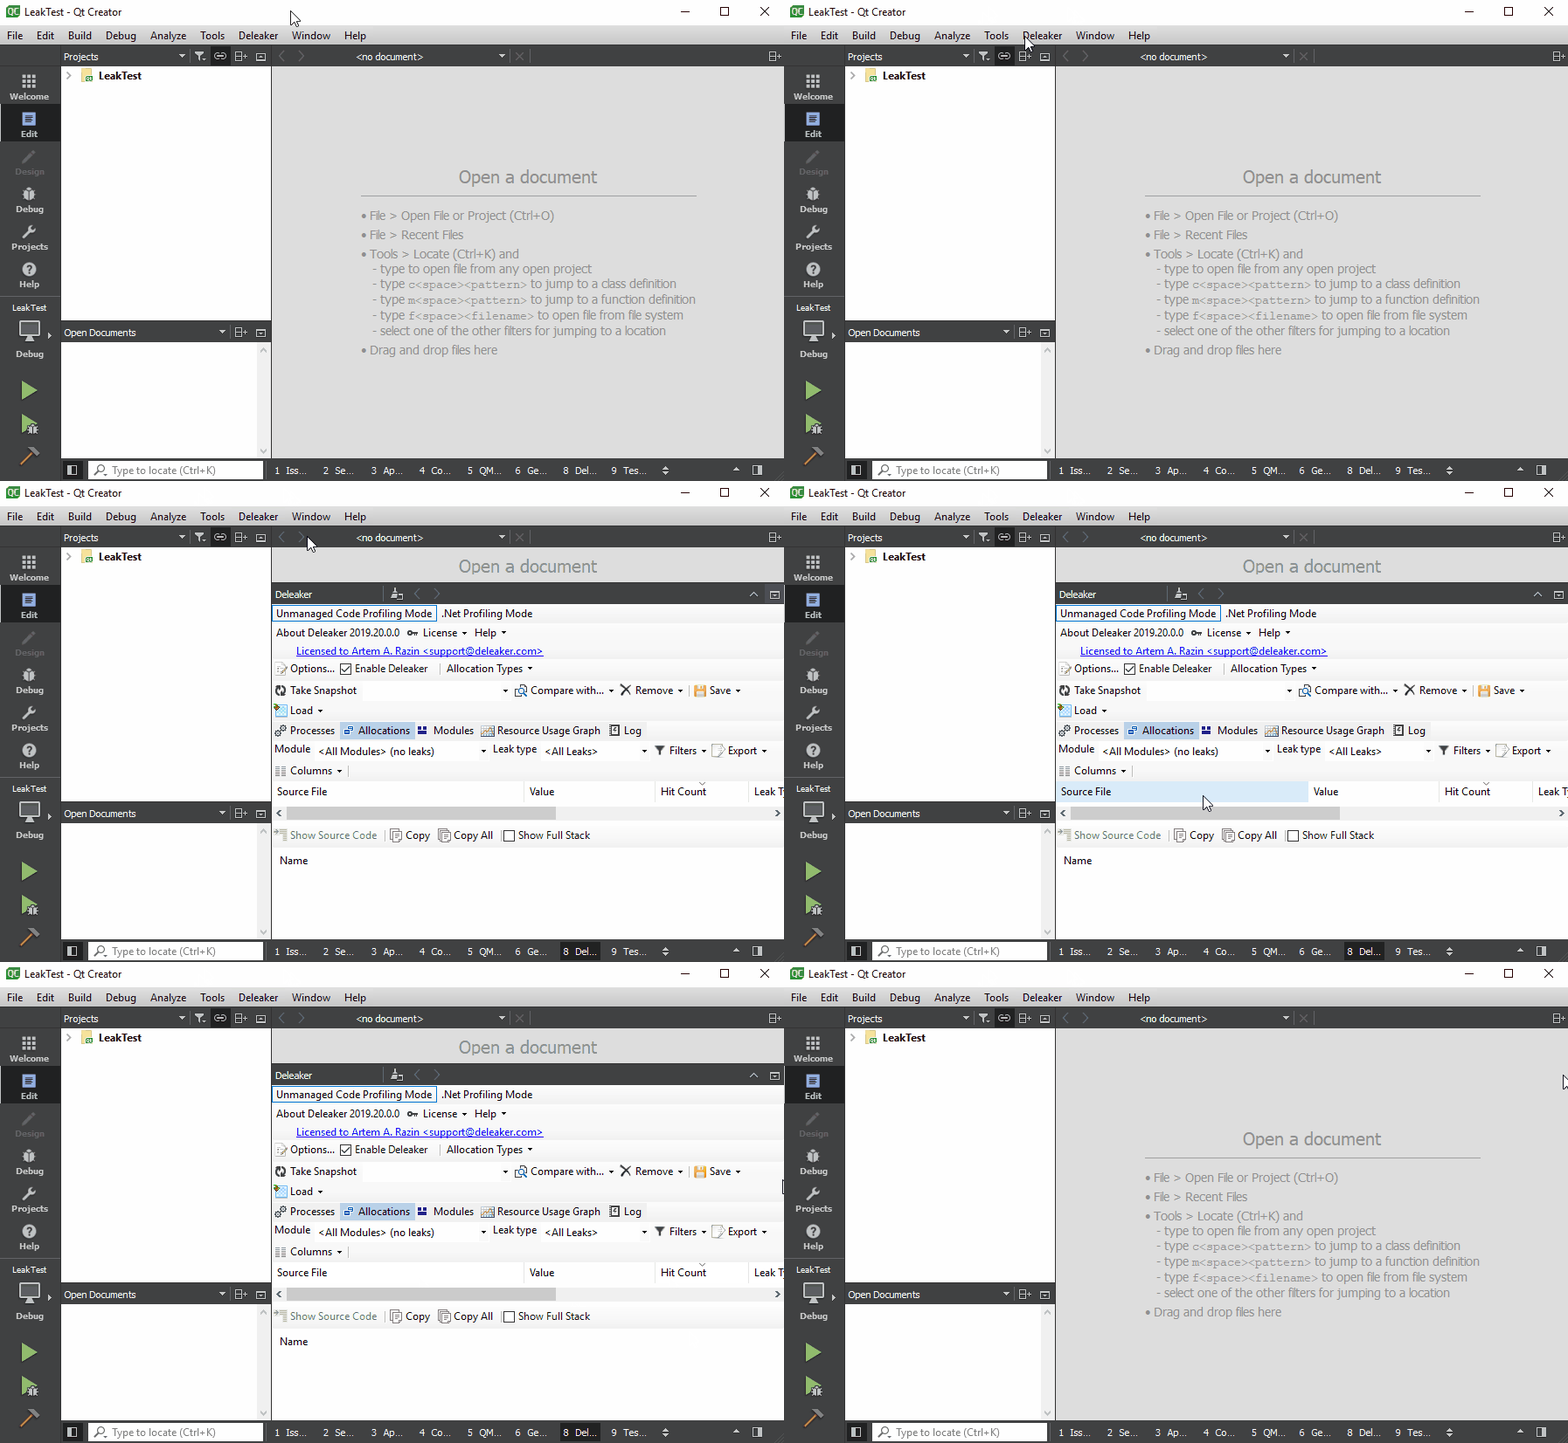
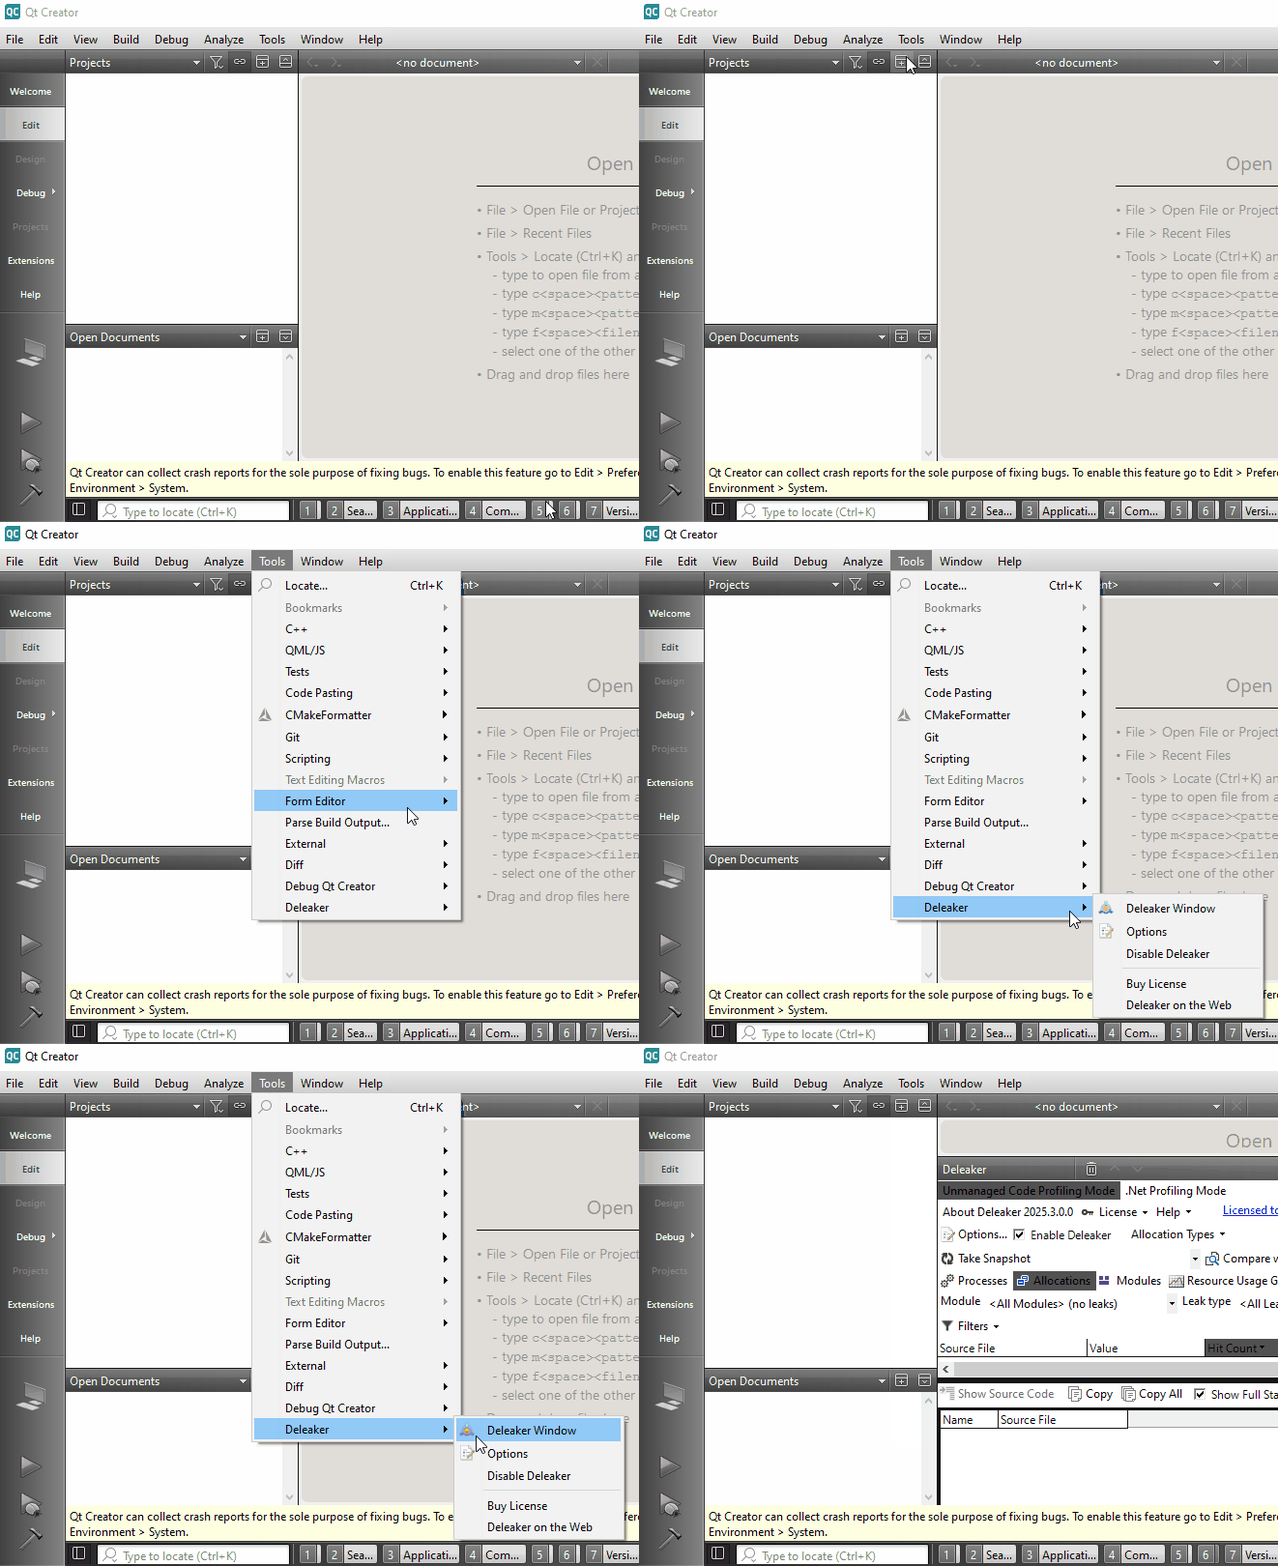
After installation, a new Deleaker item is added to the Qt Creator main menu - or under Tools for Qt Creator 17 and later. To open the Deleaker window, simply click on it:
For Qt Creator 17 and later:
Adding a memory leak
Let's create a new project (Qt Widgets Application) to look how Deleaker detects leaks.
Then introduce a leak, allocating one instance of QPushButton. Imagine that someone allocated QPushButton but then decided not to add it to a layout:
MainWindow::MainWindow(QWidget *parent) :
    QMainWindow(parent),
    ui(new Ui::MainWindow)
{
    ui->setupUi(this);

    QWidget* widget = new QWidget();
    QVBoxLayout* layout = new QVBoxLayout();
    QPushButton* button = new QPushButton("button");

    QPushButton* button1 = new QPushButton("button1");

    layout->addWidget(button);
    widget->setLayout(layout);
    setCentralWidget(widget);
}
Taking snapshots
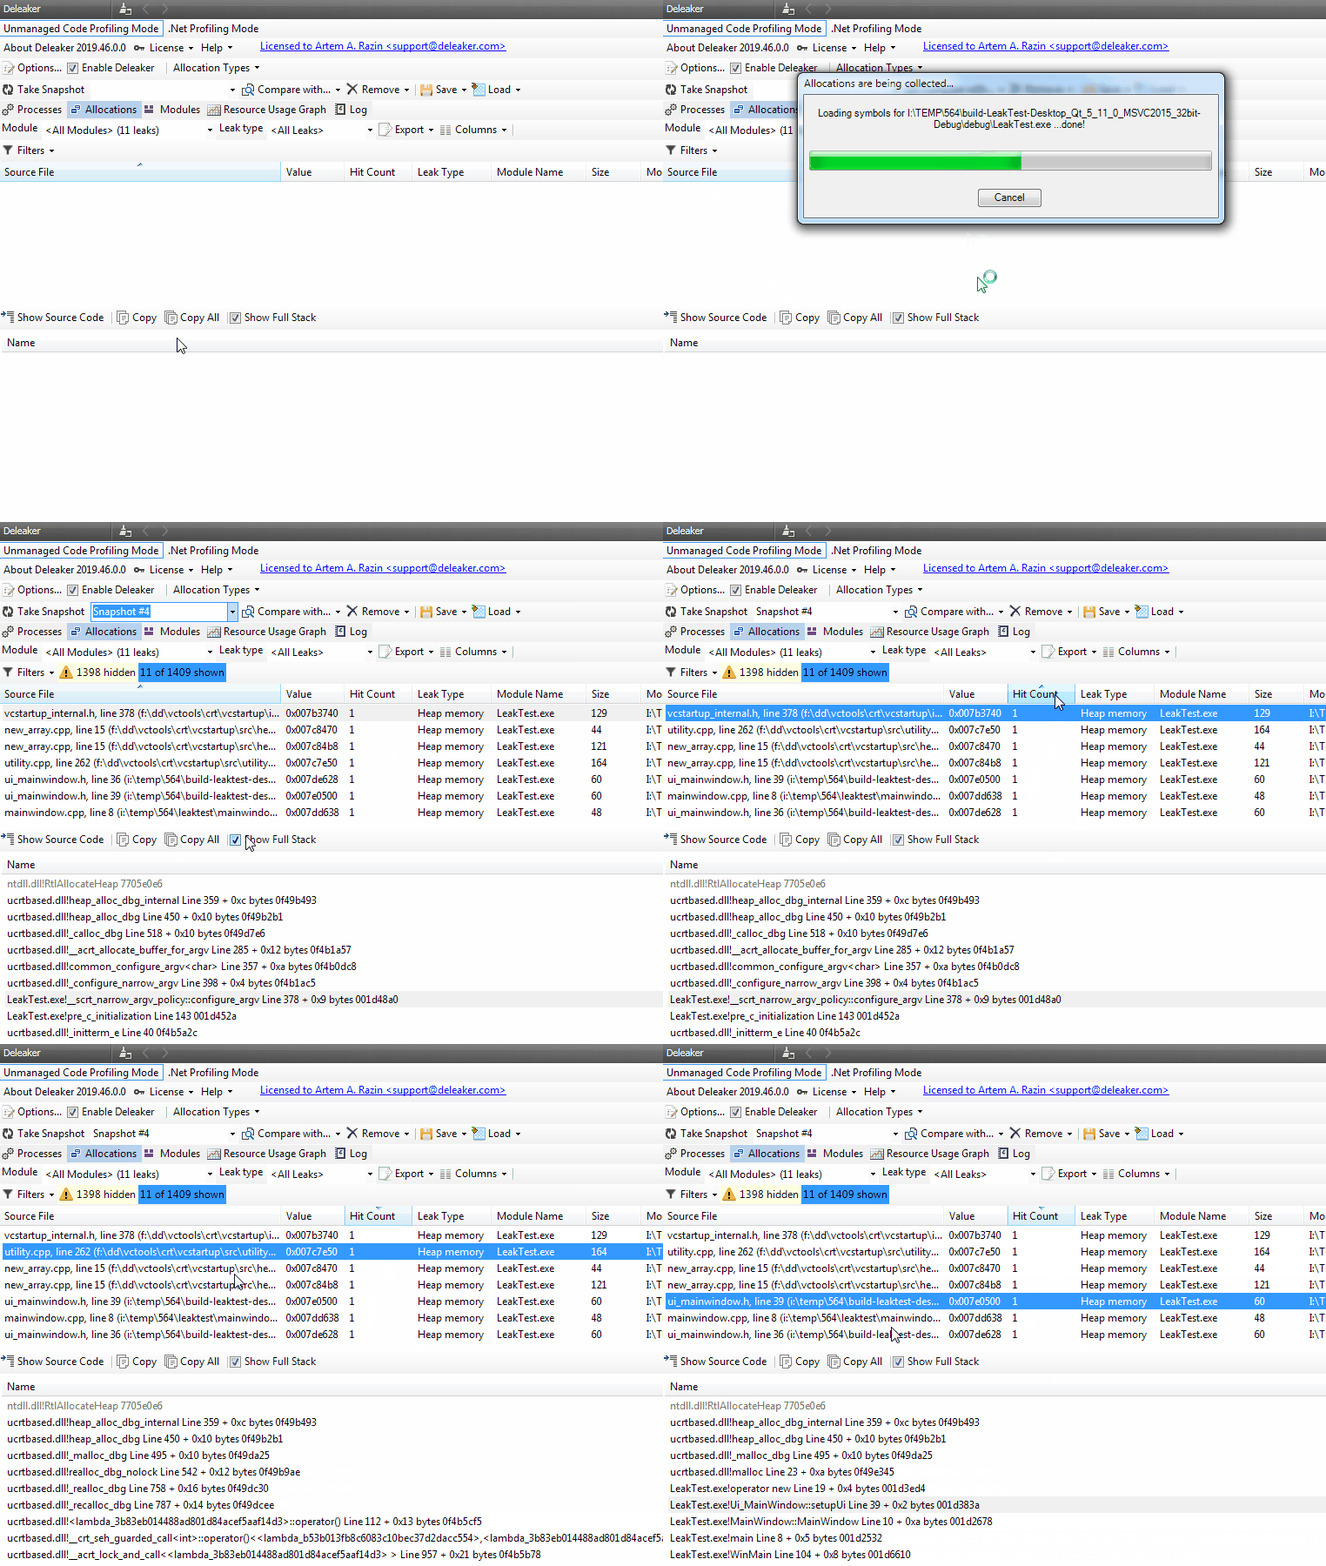
Start debugging. The main window is displayed. Switch to Qt Creator. You can explore all currently allocated resources, including memory, by clicking on Take Snapshot:
Final snapshot
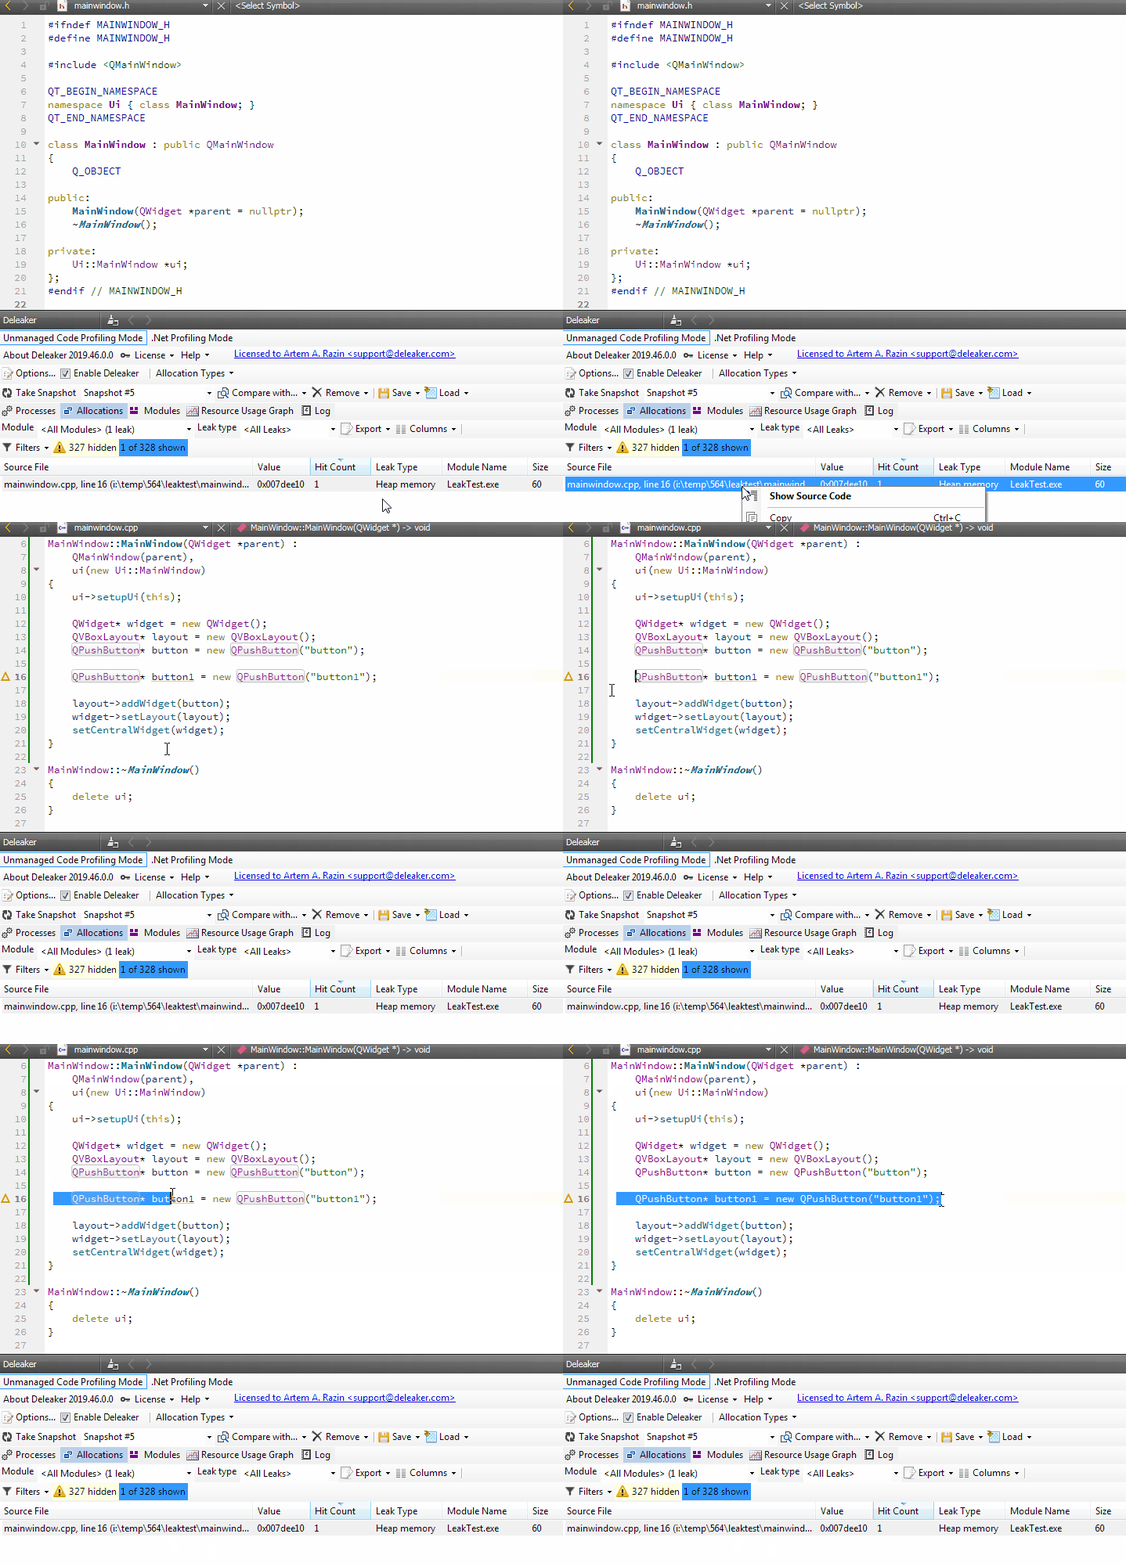
When a process exits, Deleaker automatically takes a final snapshot that contains all allocations that haven't been freed. We call such allocations as leaks.
For each memory block one can review its call stack to understand where in the code this memory was allocated.
If a source file and a line are available, Deleaker opens the source file directly in the code editor by double-clicking (or through the context menu):
How to fix memory leakage?
Sometimes a process allocates more and more memory, but don't free it. It may be correct or incorrect, depending on the logic. In case it's incorrect Deleaker offers two strategies to fix such resource leakage.
Just for example, let's add a timer that allocates some memory every 50 ms:
MainWindow::MainWindow(QWidget *parent) :
    QMainWindow(parent),
    ui(new Ui::MainWindow)
{
    ui->setupUi(this);

    QTimer *timer = new QTimer(this);
    connect(timer, SIGNAL(timeout()), this, SLOT(onTimer()));
    timer->start(50);
}

void MainWindow::onTimer()
{
    int* p = new int[10000];
}
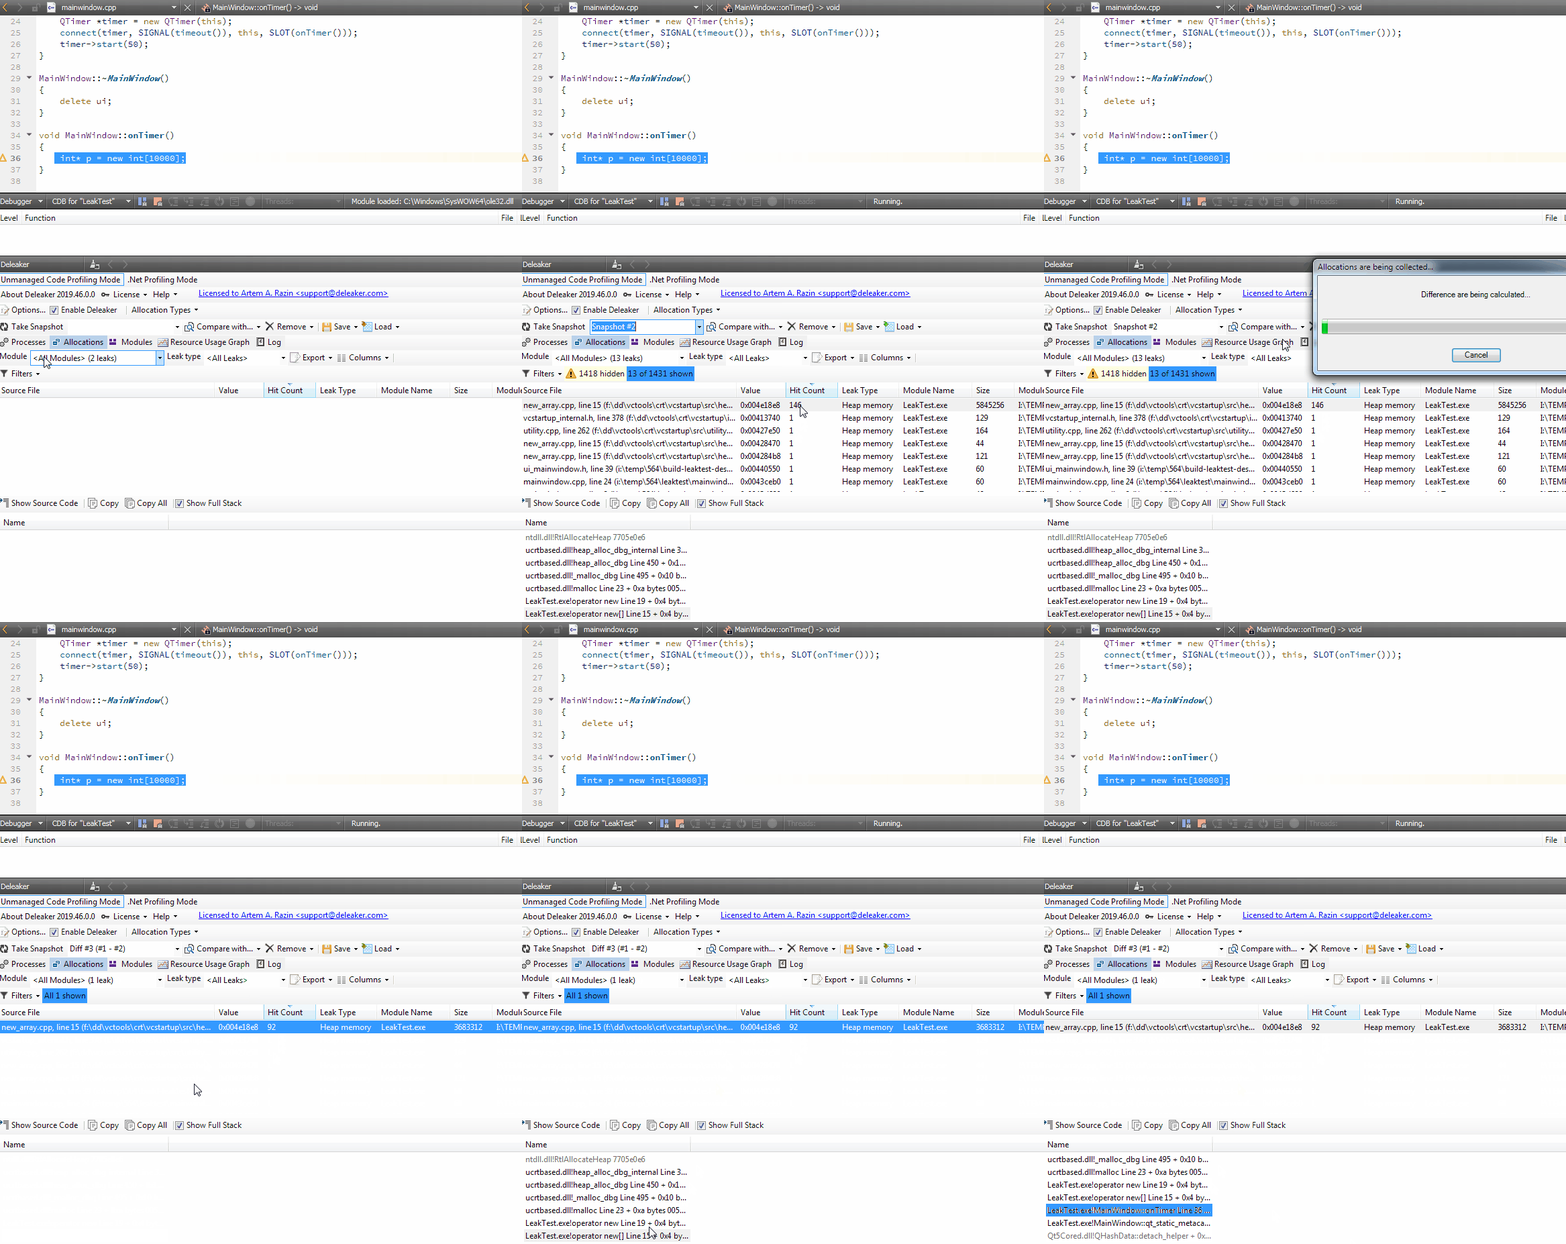
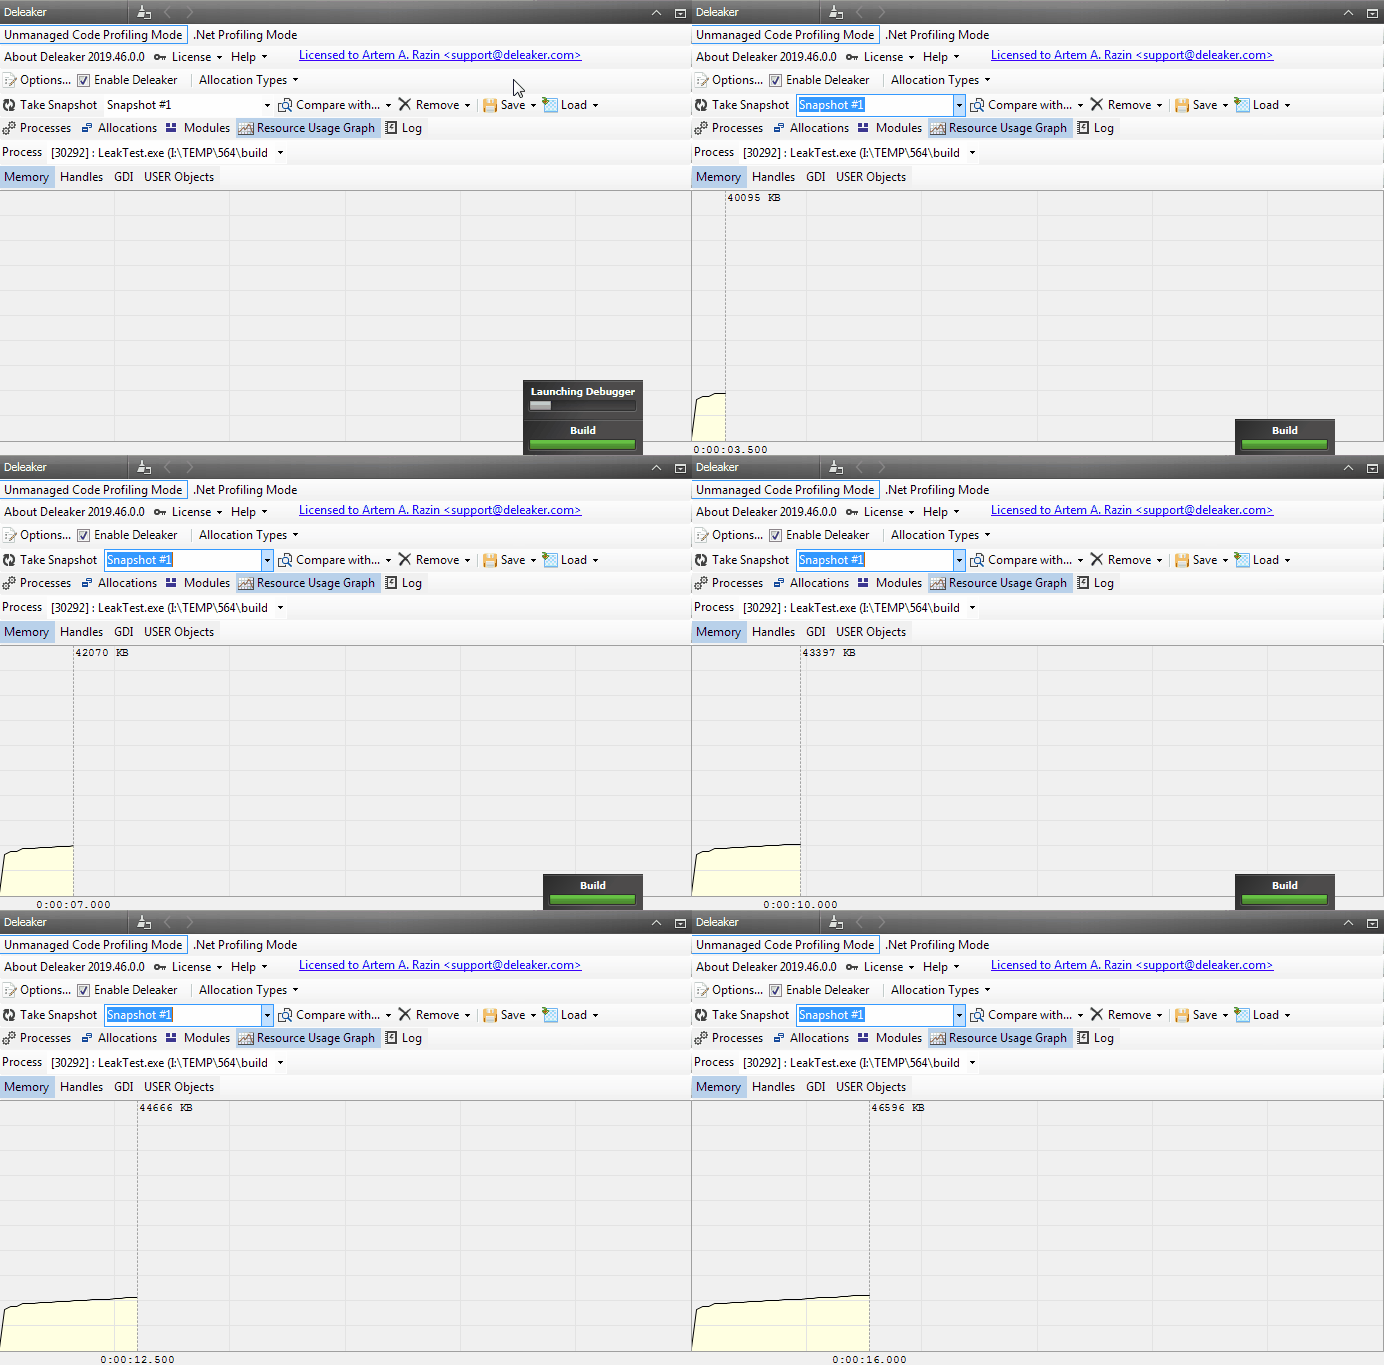
First of all, it's very easy to look at memory usage in the Deleaker:
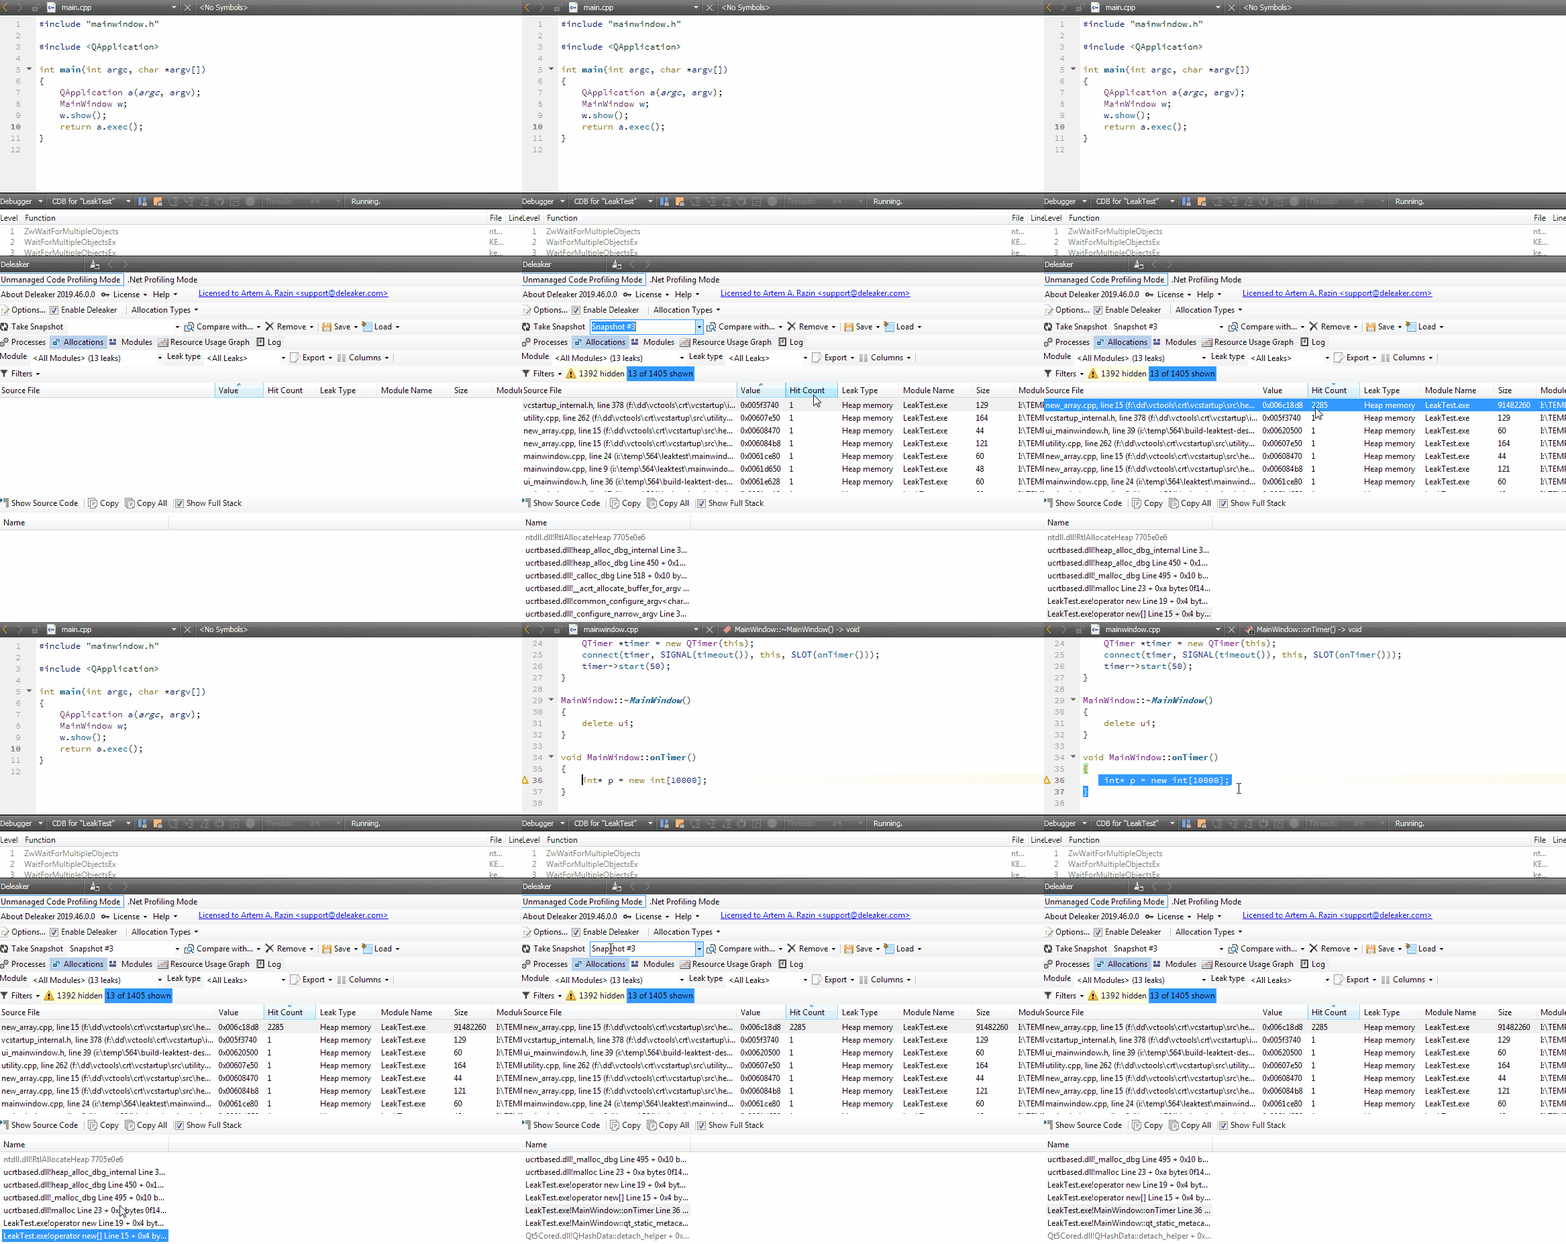
All allocations are grouped by call stacks, Hit Count shows number of allocations that have the same call stack, i.e. allocated at the same place.
So sorting by Hit Count helps to identify what places in the code constantly allocate resources:
The second strategy is the comparing consecutive snapshots to explore new allocations, i.e. those ones that exist in the second snapshot, but aren't represented in the base snapshot. Thus allocations that are not "accumulating", are not included.
Take a base snapshot, then let the process run some time to allocate more memory, and take the second snapshot. Click to Compare with... to compare snapshots. Possibly after comparing snapshots the list is empty. In this case clear all filters to see absolutely all allocations without exception.
