Visual studio memory leak detection with the help of Deleaker
Visual Studio memory leak detection is tightly integrated within Visual Studio, as Deleaker is a Visual Studio extension. When a process is being debugged by Visual Studio, the Deleaker window appears automatically. If you don't see the Deleaker window, just click Extensions - Deleaker - Deleaker Window in Visual Studio's main menu.

By default, Deleaker attaches to each process being debugged by Visual Studio. But sometimes you don't need Deleaker's assistance. In such cases, simply disable it by checking on the Enable Deleaker checkbox in the Deleaker window. Either go to Deleaker Options (available via the main Visual Studio menu: Deleaker -> Options, or via Deleaker Windows: the Options button) and set the Monitor Leaks option in the Settings section to False.

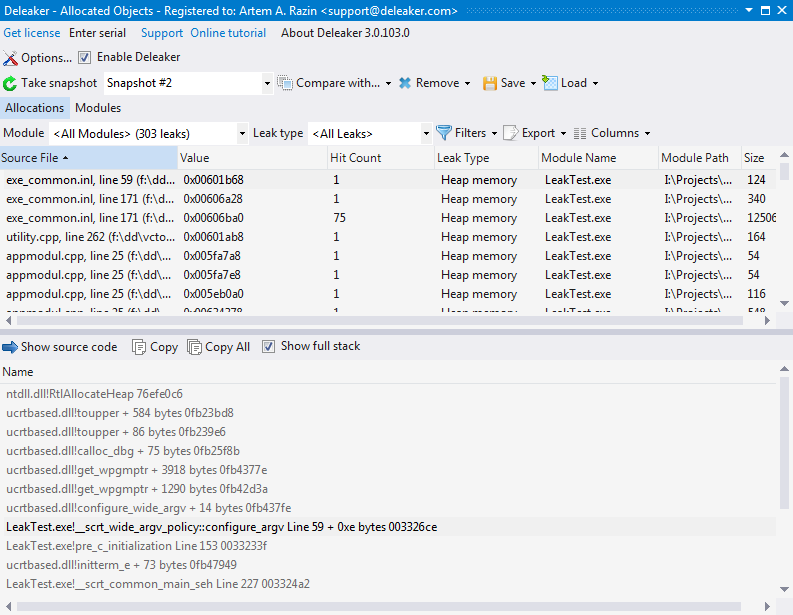
Enable Deleaker and start debugging in Visual Studio. The process runs as usual, and at any time you can go into the Deleaker window and get a list of currently available allocations (click to Take Snapshot). An allocation is any object that can leak if it was allocated but not then freed: memory block, or a handle, or initialized critical section so far.
To get this list, click on the Take snapshot button. You will see a dialog with a progress bar and some information on the current status of data collection. Let Deleaker finish the data collection process, and when it's over, you will see a list of allocations along with all details for each leak: value, source file (if available), leak type, and so on.

When a process exits, Deleaker automatically collects all memory leaks: the allocations that have not been freed.
There is one important thing related to debugging .NET code. Deleaker is able to find both managed and unmanaged leaks in .NET code: if .NET code calls DLLs written in C++, Deleaker is able to find such leaks. Nevertheless, don't forget to enable unmanaged code debugging in project settings. Without that, Deleaker can't attach to started processes.
Once you have a list of allocations, it's automatically saved by Deleaker. Deleaker calls this list a "snapshot". Comparing snapshots may be very helpful to help you find the source of leaks. We will cover this more in the Snapshots section.
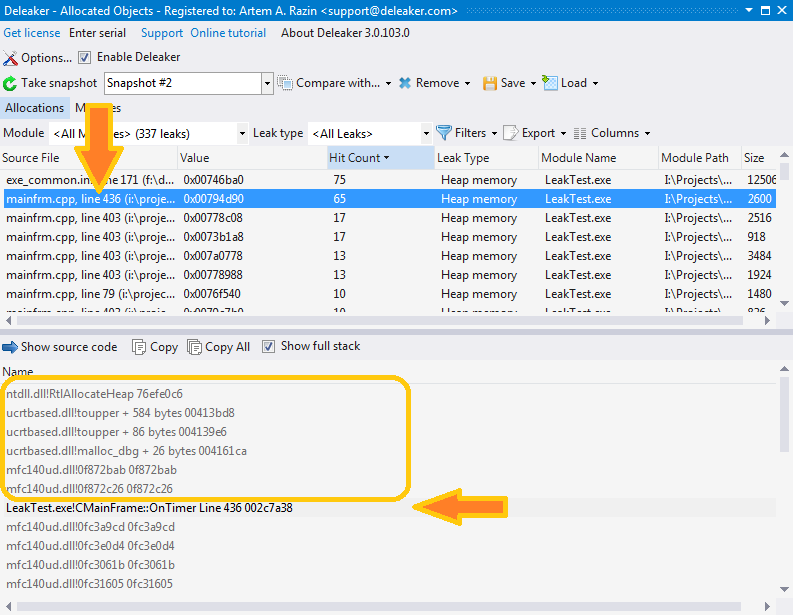
Another approach is to sort memory leaks by Hit Count. If a piece of code makes an allocation repeatedly, you will see an allocation with a high value of hit count. Usually, this is a leak.
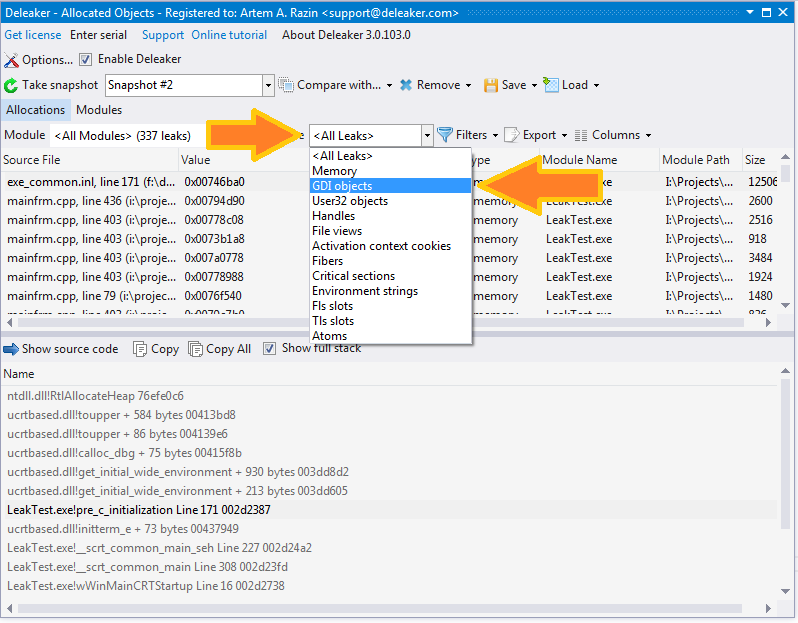
Very often, you have a problem with leaks of a certain type, e.g., with GDI leaks or with memory. By default, Deleaker shows leaks of all types, but it also allows you to filter them. Just select the leak type in the Leak type combo box, and the list will be updated; all leaks of other types will be hidden from the view.

Another filter you can use of is the calling module. What is the module of the leak? The module that causes the leak. But what's the module that actually carries out the allocation? The answer isn't as obvious as you might think. You might assume that it's the module that calls the respective function. But imagine a case when your main exe calls the new operator, and the exe is linked with C runtime dynamically. The new operator will call another function from msvcrt**.dll or mfc**.dll, and that function will call another one, and so on. Finally, HeapAlloc from kernel32.dll will be called. So, what's the module that made the allocation? It's your main exe, of course. But HeapAlloc was called from mfc**.dll!

In this scenario Deleaker calls mfc**.dll an "intermediate module". Reading the stack, Deleaker moves down skipping intermediate modules and looks for the module that will be considered the real caller module. The list of intermediate modules is available in the Settings.
So, you now know how Deleaker matches the allocation and the module. Filtering by module allows you to view which allocations were made by your modules, and which were made by others.
With the list of allocations at hand, you can then explore each leak deeper. Click on the leak, and you will see the stack trace that was saved at the moment when the allocation was made. The stack trace helps you understand where the memory leak occurred.
There are two views of a stack available: full and short. To switch between them use the "Show full stack" button. The full stack includes all the modules in the stack trace. The short stack shows only those entries that have a respective source data file. Notice that although very often such data is available, in fact there is no such source file on the disk. This data is retrieved from the debug data of the module. If you use the debug version of mfc**.dll, it includes source file references, but in most cases you won't have such files. Don't worry: just move over the stack trace entries from top to bottom to find the module that is yours. You can double-click on the entry and if the corresponding file is available, Deleaker will load the source file into Visual Studio, and move the cursor to the respective line in the file.
Snapshots
As you already know, it's possible to save a list of allocations. Once you have saved snapshots, you can switch between them. But snapshots mainly exist for the purpose of comparison. Imagine that in Task Manager you see the number of GDI leaks constantly increasing. You see that the GDI object count is 51, a few seconds later it's 52, and so on. Obviously, this is a leak. You go to the Deleaker window and click Take snapshot:


In several seconds, you click Take snapshot again and save it as well.
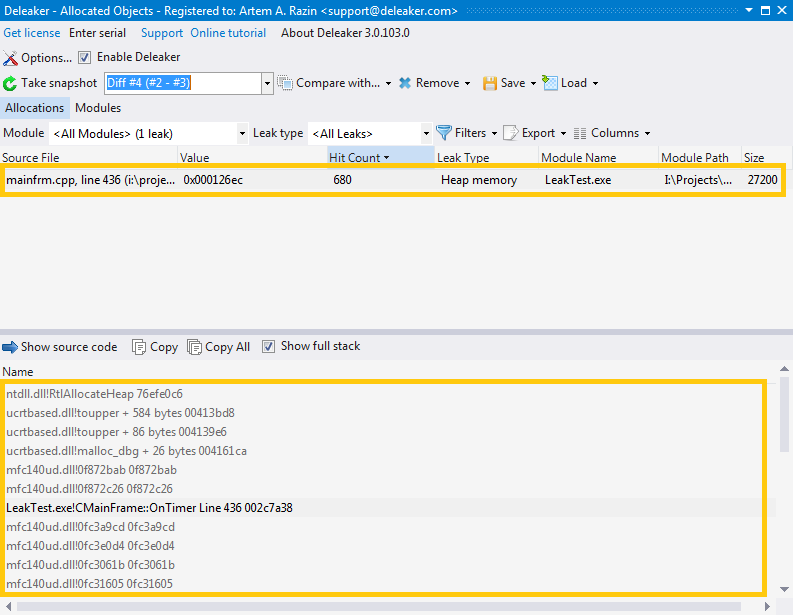
Now we just need to get the difference. Select the first snapshot in the left combo box and the second one in the Compare with...

This will show the allocations that are present in the second snapshot, but are not present in the first one. In other words, you will see the new allocations. These are the memory leaks, so check them carefully!
